Testing the effectiveness of packaging sterilisation: Truth or faith?
Posted: 30 June 2010 | Jan Bruecklmeier, Senior Aseptic Specialist, Nestlé | No comments yet
The effectiveness of packaging sterilisation devices in an aseptic filling system is often tested during start up and validation of the system. Some publications even classify the different aseptic filling systems with their average logarithmic reduction rate (ALR). According to different publications, the testing seems to be quite easy and the result is a precise parameter, characterising the process. But is this the truth?
The effectiveness of packaging sterilisation devices in an aseptic filling system is often tested during start up and validation of the system. Some publications even classify the different aseptic filling systems with their average logarithmic reduction rate (ALR). According to different publications, the testing seems to be quite easy and the result is a precise parameter, characterising the process. But is this the truth?
The effectiveness of packaging sterilisation devices in an aseptic filling system is often tested during start up and validation of the system. Some publications even classify the different aseptic filling systems with their average logarithmic reduction rate (ALR). According to different publications, the testing seems to be quite easy and the result is a precise parameter, characterising the process. But is this the truth?
Over the last couple of years, different documents were published describing how to execute such tests. The basis of most tests follows the same scheme. A number of packages are inoculated with a suspension of spores and sterilised in the system afterwards. After recovering the surviving spores from the packages, by membrane filtration for example and incu – bating them, their number is compared with the initial bioburden. Depending on the publication, the result is indicated with three valid digits after the decimal point. But as is often the case, the devil is in the details.
If we take a closer look into the said publications, we find descriptions to prepare the test suspension of spores. The majority of the said publications require a spore suspension with a spore count between 108 to 109 per millilitre. The packages for the decontamination test should have an initial spore load of at least 105. What does this mean in practice?
Accuracy of pipettes
If we look into one possible scenario, we are talking about a spore suspension of 1*109 spores per millilitre and a target spore count per package of 106 spores. This means the inoculation is done with 0.0001ml or 1μl of the spore suspension. In practice, this is done with a piston driven air displacement pipette (micro pipette). If the pipette is in compliance with DIN EN ISO 8655, a systematic error of 2.5 per cent and a random error of 1.5 per cent is a quite normal value. This is equal to a ‘total error’ of 5.83 per cent of the nominal volume using the following equation for the total error:
![]()
![]()
This means, in correspondence to the nominal volume of the pipette, a range of 1.06μl to 0.94 μl per dosing. If the initial spore suspension has a spore count of exactly 1*109 spores per millilitre, this means a real spore count level on the samples of 1*106 +/- 6*104 spores per sample.


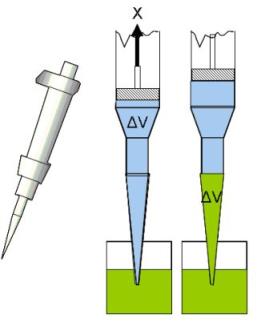
Figure 1 Principle of micro pipettes
Calibration factor of the pipettes
In addition, a standard micro pipette is calibrated, in compliance with DIN EN ISO 8655, with distilled water. This norm specifies a gravimetric calibration of the pipettes. This means a certain volume of distilled water is dosed into a tared container and weighed. With the weight of the dosed water, the volume can be calculated considering the temperature of the water.
In practice, two different spore suspensions are available. One is an aqueous suspension, but the common one is an ethanol suspension. If we consider the density of ethanol (ρ= 0.79 mg/μl), the error in volume is 0.002 μl or 2 * 103 spores, considering the target of 1 μl of the suspension with 109 spores per millilitre. This means another error of – 0.2 per cent.
Influences by temperature differences
In principle, these pipettes work with a piston changing the volume of an air filled chamber above the pipette’s tip. This volume is replaced by the fluid in which the tip is placed. If there is a difference between the temperature of the pipette and the liquid, the temperature difference leads to an increasing or decreasing volume of the air filling the chamber above the tip. This influences the volume of liquid replacing the air volume, i.e. the pipetted volume of spore suspension.
In practice, the spore suspension is stored in chilled conditions in the refrigerator and in most cases, it is mixed for some minutes before use. Nevertheless, the temperature of the suspension is lower than the temperature of the pipette and the temperature of the air filling the pipette.
The result of our tests shows a difference of 5.4 per cent less in volume if the pipette has an ambient temperature of 22°C while the suspension is taken directly from the refrigerator with a temperature of 4°C. This means in the case of a target volume of 1 μl of the suspension with 109 spores/ml, there would be 0.054 μl less volume, which is equal to 5.4 * 104 spores.


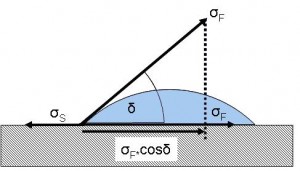
Figure 2 Contact angle and balance of forces at a drop
Summary of the variation in spore count caused by accuracy of inoculation
To summarise, with a target spore count of 1*106 spores per sample and the given accuracies, we end up with samples with a spore count ranging from 1.06*106 to 0.904*106. To keep in mind, this difference is only caused by the accuracy of the pipettes. The human factor and other systematic errors have not been taken into consideration so far.
Influence of the pipette accuracy on the calculation of the initial spore count
As discussed before,
normally the ALR is calculated as the logarithm of the initial spore count minus the logarithm of the number of surviving spores after the sterilisation process.
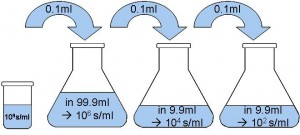
To determine the initial spore count of the suspension, a dilution series is performed following the scheme below:


A volume of one millilitre and 0.1 ml of the final suspension with a target spore count of 1*102 spores/ml is plated onto a nutrient media awaiting 100 colonies per plate and accordingly 10 colonies per plate.
The solvent, water or ethanol, for the dilution series is normally prepared with a vacuum assisted volumetric pipette. Considering the most accurate class of pipettes (class A), the maximum allowed error is still +/- 0.2 per cent of the nominal volume for 10 ml pipettes and 0.08 per cent for 100 ml pipettes.
The 100μl of spore suspension is dosed with a micro pipette. Again, if this pipette is in compliance with DIN EN ISO, a pipette with a total error of +/-3.31 μl is acceptable. This total error may result from a systematic error of 1.5 per cent and a random error of 0.7 per cent.
Therefore, in the worst case scenario, we dose 96.69 μl of the 109 spores/ ml suspension into 99980 μl solvent in the first step. The result is a spore suspension with 9.671 * 105 spores/ml instead of 1 * 106 spores/ml.
Another 96.69 μl of this suspension is dosed into 992 μl solvent, resulting in a suspension with 9.426*103 spores/ml. This step is repeated once more, leading to a suspension with 91.88 spores/ml instead of 1*102. To inoculate the nutrient media, a target volume of 1000 μl and 100 μl is transferred with a micro pipette to the nutrient media plates. Again, these volumes are defective. According to the calculation above, the plates will end up with eight colonies per plate and accordingly, 88 colonies per plate instead of 10 and subsequently 100.


Figure 3 Degree of wettability
This means the initial bioburden is estimated with 8.8*105 spores per sample instead of 1*106. If the ALR is calculated with these figures, the maximal reachable value is 5.944 instead of six, using the general equation:
![]()
![]()
Calculation of the ALR with improper figures
The ALR is an inexact used mathematical term and shows the relative number of microbes, eliminated by a disinfecting or sterilisation process. The ALR indicates the factor by which the initial germ count is reduced. For example, an ALR of six means the initial count is 1,000,000 smaller after the process or an initial count of 1*106 is reduced to one.
Going back to the example above, this means a calculated ALR of 5.940 instead of 6.000 using the estimated initial bioburden and the higher initial spore load, caused by the pipettes inaccuracy.
Influencing factor of the dispersing agent for the spore suspension
Most modern packaging materials are made from plastics with a surface tension of approximately 30 to 40 mN/m. The wettability of a material is given by the contact angle between the fluid and the material itself. The contact angle again is influenced by the surface tension of the material and the surface tension of the fluid.
Depending on the contact angle, a liquid can wet a material in three different gradations:
| Wettability | Ratio of surface tensions | Contact angle |
| Complete wettability | σFOσS | δ=0° |
| Defined wettability | σF>σS | 0<δ<90° |
| Non wettability | σF>>σS | 90°Oδ |
If we look into the surface tension of the most common dispersing agents for the spore suspensions, water and ethanol, we see quite big differences. Ethanol has a surface tension of 22 mN/m and wets the plastic material completely while water has a surface suspension of 72.75 mN/m which means a contact angle of approximate 80° for a water drop on a PE cap as an example. Under ideal conditions, we end up with an inoculation with a height of one spore for an ethanol suspension, caused by the equal, even distribution of the inoculant drop. For water with a defined wettability, on the other side, we subsequently end up with several layers of spores in the inoculation after drying.
Logically, an inoculation with an ethanol suspension, leading to one layer of spores, is much easier to decontaminate and in subsequence, the calculated killing rate will be much higher in comparison to the test with an aqueous suspension, even if the decontamination process is exactly the same.
Influence of spore sedimentation during inoculation
If we talk about a modern high speed filling system, we talk about 50 to 120 nozzles for the decontamination of the bottles. According to the different available procedures, this means between 250 and 1200 samples to be inoculated. This means the whole process of inoculation can easily last two hours from the first sample to the last.
Going back to the assumption made before to use a micro pipette with a volume of 1 μl, the most suppliers of these devices recommend an ideal immersion depth of the tip of one millimetre into the inoculums.
If we assume a radius of 1μm for a Bacillus Atrophaeus spore and a density of approximately 1300 Kg/m3,1 we get a sedimentation velocity in water of 0.0392 mm/min and for ethanol of 0.0557 mm/min. This means a spore, with the size and density described above, sinks to a depth of 4.699 mm in water and 6.684 mm in ethanol. This means a significant separation of the suspension when compared to the ideal immersion.
Summary
This article focuses on physical issues during the execution of a decontamination test. The much bigger influence is given by the normal and acceptable laboratory error during micro biological tests. This error is influenced by minimal deviations and fluctuations of the conditions during the lab work and the incubation of the microbes.
Depending on the system to recover the surviving microbes, a significant number of spores may not be recovered from the sample and accordingly may get lost during the process. With regards to membrane filtration, they get stuck in the funnel or the membrane carrier. Normally, the membranes are transferred onto the surface of the nutrient media, but this means no direct contact of spores and nutrient media, because the spores are on the top surface of the filter membrane which lies flat on the nutrient media with its bottom surface. So in fact, the membrane itself is between the spore and the nutrient media. These less-than-ideal growing conditions can inhibit growth, especially for spores damaged during the process.
Tests within a number of laboratories have shown a deviation between 2.5 per cent to 29.4 per cent for the determination of the cell count in a suspension within the same laboratory. This means the test results can vary by nearly 33 per cent within the same laboratory. And to make it clear, this test was repeated several times and the error changed significantly within the same laboratory comparing the different tests. This means there is no constant, predictable lab error and no good and bad labs.
To sum up, tests to evaluate the effectiveness of packaging sterilisation, can give a good and important indication of the decontamination process, but they should not be taken as a very precise parameter. They can be used to give information about the stability and accuracy of the process, but not really about the effectiveness. It is possible to test the system for systemic issues, like non-treated samples, but not for the ALR of the system, because with a view to all these described influencing factors, the ALR is not a constant number, but will vary from test to test.
Reference
1. Applied & Environmental Microbiology, June 1982, Vol. 43 No.6, p1307- 1310: Wet and Dry Bacterial Spore Densities Determined by Buoyant Sedimentation, L.S. Tisa, T. Koshikawa, P. Gerhardt
About the Author
Jan Bruecklmeier
Jan Bruecklmeier is working as a senior aseptic specialist at the Nestlé Product Technology Centre in Marysville, Ohio, USA. His expertise is aseptic processing and filling technologies. He was previously part of the Nestlé PTC in Konolfingen, Switzerland. He developed his knowledge of aseptic systems while working with different equipment suppliers. He studied brewing sciences and beverage technologies at the Technical University of Munich, Weihenstephan.


