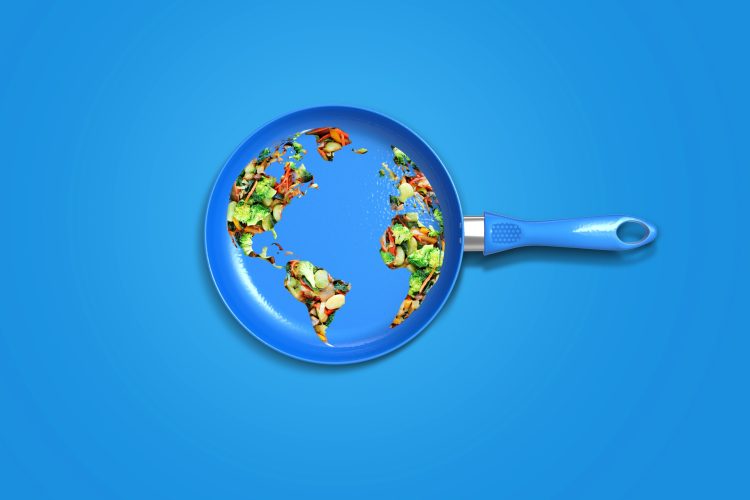
Putting the world’s food production on the map
- Like
- Digg
- Del
- Tumblr
- VKontakte
- Buffer
- Love This
- Odnoklassniki
- Meneame
- Blogger
- Amazon
- Yahoo Mail
- Gmail
- AOL
- Newsvine
- HackerNews
- Evernote
- MySpace
- Mail.ru
- Viadeo
- Line
- Comments
- Yummly
- SMS
- Viber
- Telegram
- Subscribe
- Skype
- Facebook Messenger
- Kakao
- LiveJournal
- Yammer
- Edgar
- Fintel
- Mix
- Instapaper
- Copy Link
Posted: 22 December 2022 | Grace Galler | 1 comment
Researchers have produced a digital map that shows the pressure that the global food system exerts on the environment and climate.


Researchers at the Norwegian University of Science and Technology have produced a digital map that depicts the pressure that the global food system exerts on the environment and climate.
“No one has done this before, and the mapping has been a gigantic task,” said Daniel Moran, a researcher at the Norwegian University of Science and Technology’s (NTNU) Department of Energy and Process Engineering.
“The food system is the biggest threat to biological diversity and one of the worst drivers of the climate crisis,” explained Morgan.
Carrying out the research, Moran collaborated with 16 researchers, including some from the University of Leeds and the University of California, Santa Barbara.
Explaining the impacts of food production, Morgan said: “There are lots of different foods on the planet and numerous ways to produce them.
“The environmental consequences are manifold and difficult to calculate. By gaining a better understanding of the negative impacts, we can achieve more environmentally efficient food production.”
Five culprits
According to the study, five countries account for almost half of the global environmental impact from food production. These countries are China, India, the USA, Brazil and Pakistan.
However, the researchers have not “crowned” the countries with the smallest environmental footprint, reasoning that “these are poor countries that live with food shortages and hunger”.
Researchers said that they obtained data on 99 percent of all food production in water and on land that was reported in 2017.
The research group said that it considered the main types of pressure that food production exerts on the environment: CO2 emissions, water consumption, destruction of habitats and pollution.
They have also followed the entire “life cycle” of the food (from sowing the grain and birth of the piglet all the way to the bread and bacon on the consumer’s table) to determine the total environmental impact.
Food miles
The researchers have also looked into food miles as part of their study, however, they have said that this was “not easy”.
They note that a frozen pizza can have ingredients from several countries. As an example, Denmark, (which exports pork), simultaneously imports pig feed.
The researchers’ study considers the sea, water and land as a whole, and consequently uses data to form a more holistic understanding of food miles and their impact on the planet.
Overall findings
The research alleges that 90 percent of all food production takes place on 10 percent of the world’s land area.
What’s more, it claims that dairy product and beef production takes up 25 percent of agricultural land. However, the survey shows that farming with pigs poses a greater environmental burden, mostly due to the large amount of resources used to produce feed.
Why the study is useful
Morgan attended COP27 in Egypt in 2022, where he reportedly learnt that “the research project he has been involved with had already been put to use”.
The Nature Conservancy will reportedly be using the study to advise global food giants on how to find the most environmentally efficient solutions.
To view the digital map, click here.
Related topics
Data & Automation, Environment, Research & development, Supply chain, Sustainability, Trade & Economy, World Food
Related organisations
Norwegian University of Science and Technology, University of California, University of Leeds


Nice article! Thanks for sharing informative post Keep posting