Coupling NIR spectroscopy and chemometrics for the assessment of food quality
- Like
- Digg
- Del
- Tumblr
- VKontakte
- Buffer
- Love This
- Odnoklassniki
- Meneame
- Blogger
- Amazon
- Yahoo Mail
- Gmail
- AOL
- Newsvine
- HackerNews
- Evernote
- MySpace
- Mail.ru
- Viadeo
- Line
- Comments
- Yummly
- SMS
- Viber
- Telegram
- Subscribe
- Skype
- Facebook Messenger
- Kakao
- LiveJournal
- Yammer
- Edgar
- Fintel
- Mix
- Instapaper
- Copy Link
Posted: 28 February 2013 | Federico Marini, Department of Chemistry, University of Rome ‘La Sapienza’ | No comments yet
In the last 30 years, there has been increasing attention paid to the possibility of using Near Infrared (NIR) spectroscopy to deal with different aspects of food quality assessment. Indeed, the intrinsic characteristics of this technique, which, requiring little or no sample pretreatment, allows high throughput analyses in a rapid and non-invasive/non-destructive way, together with its easy on-line applicability, make NIR particularly suitable for real-time assessment and control of food quality both in a laboratory and on an industrial scale.
In the last 30 years, there has been increasing attention paid to the possibility of using Near Infrared (NIR) spectroscopy to deal with different aspects of food quality assessment. Indeed, the intrinsic characteristics of this technique, which, requiring little or no sample pretreatment, allows high throughput analyses in a rapid and non-invasive/non-destructive way, together with its easy on-line applicability, make NIR particularly suitable for real-time assessment and control of food quality both in a laboratory and on an industrial scale.
In the last 30 years, there has been increasing attention paid to the possibility of using Near Infrared (NIR) spectroscopy to deal with different aspects of food quality assessment[1]. Indeed, the intrinsic characteristics of this technique, which, requiring little or no sample pretreatment, allows high throughput analyses in a rapid and non-invasive/non-destructive way, together with its easy on-line applicability, make NIR particularly suitable for real-time assessment and control of food quality both in a laboratory and on an industrial scale.
From a physico-chemical standpoint, the near infrared region of the electromagnetic spectrum corresponds to high energy vibrational transitions (overtones and combination bands), which, differently to what happens in the mid-infrared frequencies, result in low intensity bands which are often highly overlapped and difficult to interpret directly. This is the main reason why the growth of applications involving the use of this technique accompanied and followed the development and diffusion of chemometric methods to process the spectral data, where the name ‘chemometrics’ indicates the discipline, which makes use of math ematical, statistical and logical methods to solve chemical problems and to extract the maximum possible information from the measured data[2]. Indeed, when the instrumental signals are noisy and/or poorly specific, and, in general, when a large number of variables (i.e., spectral intensities at different wavelengths) are recorded for each sample, the information which is sought is often hidden and hard to unravel by simply looking at the instrumental profiles recorded. In the following article, some successful examples of coupling chemometric data processing methods to NIR spectroscopic analysis of foodstuff will be presented.
Traceability
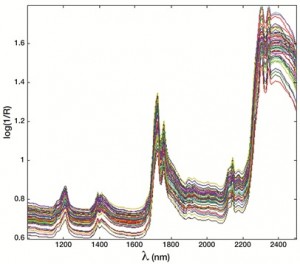
It has been widely recognised that, for many foodstuffs, origin (geographic, species and production) represents an important quality attribute to the point that in 1992, the EU introduced norms concerning the Designations of Origin (Protected Denomination of Origin (PDO) and Protected Geographical Indication (PGI)) to protect typical products[3]. In this framework, the use of NIR spectroscopy coupled to opportune classification methods constitutes a promising approach for tracing the origin of foodstuff in a rapid, relatively cheap and non-destructive way. Indeed, the aim of chemometric classification methods is to build models that allow the accurate prediction of a qualitative property of the samples, based on the experimental fingerprint: as far as traceability problems are concerned, origin is the qualitative property to be predicted. To illustrate this concept, a case study concerning the authentication of olive oil samples from the PDO of Sabina (Italy) will be presented[4]: in this case, the scope of the research was to build a model that was able to recognise samples coming from a particular PDO area (Sabina, an oil-producing area in central Italy), based on the analysis of the spectral fingerprint. To this purpose, olive oil samples from both the Sabina area and from other origins, not only in Italy but also the rest of the world, were collected and analysed by NIR spectroscopy (see Figure 1).
Indeed, classification methods belong to the family of so-called supervised algorithms, i.e. those algorithms requiring that a set of samples for which the desired response (in this case, the geographical origin) is known (training set) is available, as this information is actively used in building the models. In particular, since in the example described in this paragraph attention was mainly focused on the PDO of Sabina, only two categories were defined: oils from Sabina and oils from other origins (irrespectively of their provenance). Classification of the oils (after spectral pre-treatment by the first derivative) was then accomplished by means of an algo rithm called Partial Least Squares-Discriminant Analysis (PLS-DA), a method which is particularly suitable for dealing with high dimensional data, i.e. data containing many variables, like the spectral fingerprints, providing at the same time a parsimonious description of the samples in terms of a few latent (abstract, mathematically constructed) variables, which facilitates the interpretation of the results and a reliable prediction of the origin of unknown individuals. These characteristics are well exemplified in Figure 2 (page 8), where the projection of the samples onto the space spanned by the first three latent vectors of the model is shown: in Figure 2 (page 8), the training samples are represented as points in the multivariate space, which appear to be clearly separated in two different groups, the first one corresponding to the extra virgin oils from the PDO Sabina, and the second one to the oils of other geographical origins.
The good separation between the two groups in space suggests that the use of the model to predict the origin of unknown samples should result in a high correct classification rate. Accordingly, when the model was applied to the NIR spectra collected on validation samples from both categories (i.e., samples of known origin which were not used in the model building phase), 100 per cent of the oils from Sabina and 95.5 per cent of those from other origins were correctly predicted. Indeed, when looking at the position of the test samples in the model space, reported in Figure 2 (page 8), it is possible to observe that they fall well inside the areas occupied by their respective categories, thus allowing an accurate prediction of the correct origin of the oils used for validation.


Figure 2 PLS-DA analysis of the olive oil data set: projection of the training and test samples from the two categories
Sabina and Other origins onto the first three latent variables calculated by the model. Legend: ●Sabina training; ■
Other origins training; ● Sabina test; ■ Other origins test
Quantification of food ingredients
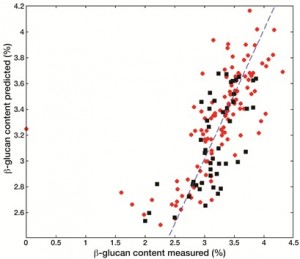
The same concepts described in the previous paragraph for qualitative responses can be extended to the cases where the variables to be predicted are of a quantitative nature, such as, for instance, the concentrations of some food constituents or the values of analytical indices used for quality control (e.g., peroxide value or iodine value). The methods involved are gathered under the name of multivariate calibration techniques and aim at finding a relationship between a multivariate signal (e.g., the spectral fingerprint) and one or more real-valued dependent variables. Quite often, this relation is assumed to be as simple as possible, meaning that a linear dependence is postulated. In this framework, the algorithm which is most often used when there are many highly correlated predictors is Partial Least Squares regression (PLS). PLS is the same algorithm which constitutes the basis of the PLS-DA classification algorithm discussed in the previous paragraph, as the names suggest, and its main characteristic is to look for directions onto which to project the samples which have the highest covariance with the responses to be modelled. This means that PLS provides a parsimonious representation of the data set, projecting the individuals onto a lowdimensional space whose axes have the highest correlation with the dependent variables, at the same time explaining as much of the variability in the predictor space as possible. As an example, the possibility of using NIR spectroscopy to quantitate two important nutritional factors in naked oat samples will be presented here[5]. Indeed, the same spectroscopic fingerprint can be used as independent variables block to predict more than one constituent in the same food matrix, allowing a rapid, nondestructive and multi-component analysis. In particular, in the example discussed in this paragraph, this advantage was used to build calibration models for the simultaneous prediction of protein content and β-glucan in naked oat samples. The high content in dietary fibres, and in β-glucan, has triggered an increasing interest towards the use of oats in human consumption, especially after many recent studies have evidenced that these nutritional factors can have physiological effects and a positive impact on some of the risk factors responsible for cardiovascular diseases. In this framework, it must be pointed out that the available analytical methods for the quantification of β-glucan in oat samples are destructive, require a long and cumbersome sample preparation and sometimes don’t even possess the required accuracy. It is in cases like this that the advantages of the coupling of NIR spectroscopy to chemometrics emerge and are more evident. The approach described in this paragraph allows not only an accurate and nondestructive determination of the component of interest, β-glucan, but also the possibility of using the same spectral fingerprint to predict, without the need of performing further experiments, another important nutritional factor on the same samples (protein content). The results of the two calibrations are reported in Figure 3, both for the training samples and the test set that was used to validate the model, and it is apparent that in both cases the PLS models allow an accurate quantification of the variables to be predicted.
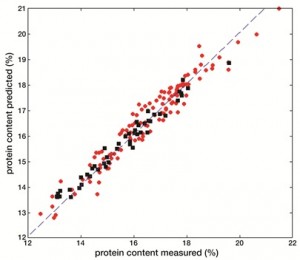

Figure 3 Results of PLS analysis for the quantification of b-glucan (a) and protein (b) content in naked oat samples. Legend: ●Training samples; ■Test sample
Moreover, when using a calibration method based on the projection of the samples onto latent variables, it is possible to identify the spectral regions which are most correlated with the responses and therefore to obtain a better interpretation of the results in terms of significant bands. In particular, an index called VIP, expressing how much the single experi mental variable contributes to the bilinear calibration model, was computed for this purpose. As a result, the regions between 400 and 700 nanometres, around 1150 nanometres and between 1900 and 2300 nanometres were found to contribute the most to the model for β- glucan: this outcome is particularly relevant as the latter region is reported in the literature to be an important band for polysaccharides, corresponding to OH stretching/deformation and C-O/O-H stretching combination bands. Similar considerations can be made for the model for the prediction of protein content, for which the relevant regions were found to be those between 400 and 700 nanometres, around 1100 and 1500 nanometres and between 2250 and 2498 nanometres, the latter two intervals corresponding to N-H deformation bands.
When the relationship between the responses and the predictors is not linear or can’t be reasonably approximated to be linear, it is still possible to achieve accurate calibrations in the framework of PLS regression. One example of this is to use models which are only locally linear and not linear over the whole data range, by identifying, whenever an unknown sample has to be analysed, the training samples most similar to it and building the regression model using only the data from these samples. This approach was applied, for instance, to build a model for the prediction of egg content in egg pasta samples produced under different manufacturing conditions, especially concerning drying time and temperature[6]. When inspecting the effect on the different processing conditions on the NIR fingerprint, it was found that nonlinearities in response could arise from the interaction of drying temperature and egg content: this hypothesis was also proved by the relatively high prediction error obtained on the validation set when using a globally linear model. On the other hand, by adopting a local PLS approach, a very accurate prediction of the response could be obtained, the prediction error being almost half of that resulting from standard PLS.
Conclusions
The coupling of near infrared spectroscopy with chemometric data processing techniques provides a valid tool to tackle different problems related to food authentication and quality control in a versatile way. The examples described in this article show that qualitative and quantitative predictions can be obtained on different samples with high accuracy and almost always without the need of sample pre-treatment.
References
- Y. Ozaki, W. F. McClure, and A.A. Christy (Eds.), Near- Infrared Spectroscopy in Food Science and Technology, John Wiley and Sons, New York, 2003
- D.L. Massart, B.G.M. Vandeginste, S.N. Deming, Y. Michotte, and L. Kaufman, Chemometrics. A textbook, Elsevier, Amsterdam, 1988
- European Commission, Regulation (EC) no. 2081/1992, Off. J. Eur. Union L208 (1992) 1–8
- M. Bevilacqua, R. Bucci, A.D. Magrì, A.L. Magrì, F. Marini, Tracing the origin of extra virgin olive oils by infrared spectroscopy and chemometrics: A case study, Anal. Chim. Acta, 717 (2012) 39– 51
- S. Bellato, V. Del Frate, R. Redaelli, D. Sgrulletta, R. Bucci, A.D. Magrì, F. Marini, Use of Near Infrared Reflectance and Transmittance Coupled to Robust Calibration for the Evaluation of Nutritional Value in Naked Oats, J. Agric. Food Chem., 59 (2011) 4349-60
- M. Bevilacqua, R. Bucci, S. Materazzi, F. Marini, Application of near infrared (NIR) spectroscopy coupled to chemometrics for dried egg-pasta characterization and egg content quantification, Food. Chem., in press. http://dx.doi.org/10.1016/j.foodchem.2012.11.018
Biography
Dr. Federico Marini is a researcher at the University of Rome ‘La Sapienza’, where he also teaches chemometrics at both the undergraduate and graduate levels. His research interests involve the development and application of classification methods, especially in the field of food authentication, nature-inspired methods (artificial neural networks, genetic algorithms, particle swarm optimisation) and multiway analysis.


