Mapping food composition using NIR hyperspectral imaging
Posted: 18 August 2008 | S.J. Millar, M.B. Whitworth, A. Chau, Campden & Chorleywood Food Research Association and J.R. Gilchrist, Gilden Photonics Ltd | No comments yet
Near infrared (NIR) spectroscopy is widely used in the global agri-food industry for the non-destructive assessment of both the compositional and physical characteristics of a wide range of raw materials and finished products. This is particularly so in the cereals and related industries where, following the commercial development of suitable NIR instrumentation in the 1970s, the technique rapidly became the main means of determining a range of compositional properties which form the basis of trading operations worldwide.
Near infrared (NIR) spectroscopy is widely used in the global agri-food industry for the non-destructive assessment of both the compositional and physical characteristics of a wide range of raw materials and finished products. This is particularly so in the cereals and related industries where, following the commercial development of suitable NIR instrumentation in the 1970s, the technique rapidly became the main means of determining a range of compositional properties which form the basis of trading operations worldwide.
Near infrared (NIR) spectroscopy is widely used in the global agri-food industry for the non-destructive assessment of both the compositional and physical characteristics of a wide range of raw materials and finished products. This is particularly so in the cereals and related industries where, following the commercial development of suitable NIR instrumentation in the 1970s, the technique rapidly became the main means of determining a range of compositional properties which form the basis of trading operations worldwide. Traditional NIR techniques generate information on the bulk properties of a sample or a portion taken from it. However, there are many aspects of ingredient and product properties which result from heterogeneity in composition and the monitoring of this aspect of quality is considerably more challenging. In the last few years, technology which allows NIR hyperspectral imaging of foods has become available, raising the potential for NIR to be used to assess the spatial distribution of food composition. This technology was primarily developed for military and remote sensing applications and has now been developed for laboratory use, particularly in the pharmaceutical industry. CCFRA has developed an approach using such instrumentation which is applicable to a wide range of food products. This article serves to give an overview of this exciting new technology as well as illustrations of approaches taken to address a number of industry problems.
Principles of NIR hyperspectral imaging
The underpinning technology is NIR spectroscopy, which typically relates to the interaction of electromagnetic radiation with matter in the 700-2500 nanometre wavelength region. This contains information related to specific molecular bonds such as C-H, O-H and N-H. As these bonds form the basis of many of the main components of foods such as proteins, carbohydrates, fats and water, the region may be used to determine their relative quantities. In addition to the selective absorption of energy by these bonds, the physical characteristics of materials also interact with the incident radiation, leading to a mechanism for determination of the structure of many food ingredients or products. However, as NIR spectra represent information based on both these aspects, compositional and physical, it is usually necessary to develop calibrations relating spectral information from a defined set of samples to the reference measurements of interest, for example, protein content. Both NIR bulk and NIR hyperspectral imaging approaches rely on the same underpinning technology, but the key difference is that in the imaging technique, entire spectra are collected for each pixel within the image. By assessing characteristic spectral features at each pixel or by using calibrations to quantify individual components, an image of the food components may be generated, thus allowing quantification of their spatial distribution. While the final output from such systems may be delivered in a straightforward way that facilitates its application, the underpinning information collected requires considerable data management and analysis. The basic response for a given sample is collected in the form of a 3-dimensional data set, a datacube, which has two spatial dimensions and a spectral (wavelength) dimension (Figure 1). As a result, images may be viewed at individual wavelengths or the spectra for individual pixels may be assessed. By collecting spectra for regions having known levels of components of interest (for example, moisture content), calibrations may be derived. By applying these to unknown pixels, images of the distribution of the relevant component may then be generated.
Instrumentation for hyperspectral imaging
To enable a 3-dimensional datacube to be collected, instrumentation for hyperspectral imaging uses a 2-dimensional sensor array to acquire slices of the datacube sequentially, while scanning over the third dimension. There are two main approaches for this, representing either time-resolved spatial data acquisition or time-resolved wavelength data acquisition. The former, often called push-broom imaging, uses a spectrograph in front of the imaging camera. A narrow line of the sample is imaged onto a row of pixels on the sensor chip and the spectrograph generates a spectrum for each point on the line, spread across the second dimension of the chip. The underlying data, therefore, represent spatial information for a single line of pixels in one direction and the spectral information in the other. By moving the sample, spectrograph or camera, sequential line scans may be collected and used to generate the final datacube. In the other approach, referred to as staring imaging, both spatial dimensions are collected at a single wavelength and images for successive wavelengths are then combined to generate the final datacube. Typical examples of such a system use a tuneable filter in front of the camera to select the wavelengths for which an image is presented for capture.
The hyperspectral imaging system at CCFRA
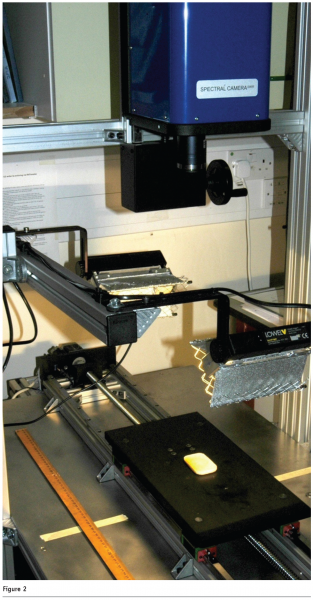
The system at CCFRA is based on push-broom principles, with the sample stage moving to allow successive line scans to be collected. Such an approach was adopted as it seemed likely to facilitate development of applications where the foods of interest are transported on a system of conveyer belts. The system has been constructed by Gilden Photonics Ltd using a Specim (Oulu, Finland) 14 bit MCT camera and N25E spectrograph covering a wavelength range of 970-2500 nanometres (Figure 2). The high speed nature of the camera allows spectra to be collected from samples in a few seconds, thus minimising sample changes induced as a result of heating from the illumination sources. The imaging chip has dimensions of 320 (spatial) × 256 (spectral) pixels. During the design phase, representatives of Gilden Photonics Ltd and CCFRA gave careful consideration to the working height of the camera over the presentation stage as well as the availability of suitable lenses to ensure that a wide range of spatial dimensions and thus resolutions could be accommodated. As a result, spatial resolutions for individual pixels range from ~30µm up to ~1 millimetre. The width of the viewing area (swath) is defined by the working distance and focal length of the lens used, but length of each image is defined by the length of the moving stage. As a result, relatively long samples (such as entire fish) may be accommodated.
Assessing moisture migration in bakery products
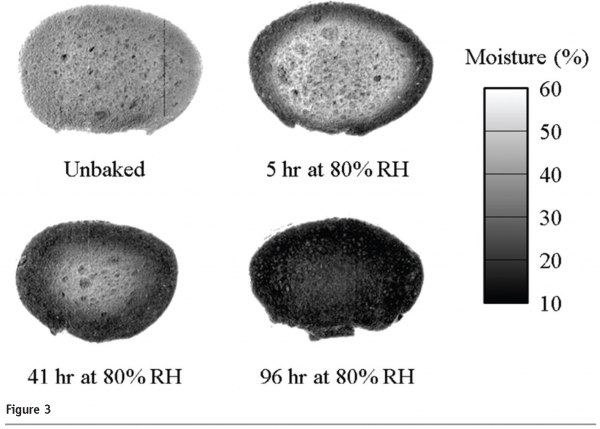
The process of staling in bakery products represents a complex interaction between a number of processes. While it is recognised that starch retrogradation is the main determinant of staling in sandwich bread, the loss of moisture from products with relatively higher surface area to volume ratios is also a factor in product firming during storage. In addition, moisture migration in composite food products can also have a profound impact on product acceptability. NIR hyperspectral imaging was used to determine moisture migration in part-baked baguettes following final bake-off and subsequent storage. Commercial part-baked baguettes were baked off at 220°C for 11 minutes, with steam injection for the first 10 seconds. The samples were cooled for 45 minutes on a wire rack and then divided into three batches which were stored at different humidity conditions (ambient approximately 50 per cent R.H. uncontrolled, constant 65 per cent R.H., constant 80 per cent R.H.) to achieve different rates of moisture loss. Replicate baguettes were removed from storage at intervals of time for measurement. Slices were cut and immediately presented to the imaging system to ensure that the measurements were representative of the internal composition. NIR calibrations for crumb moisture content were generated by cutting cores of a defined size (a central 20 millimetre diameter circle and a surrounding 30 millimetre diameter annulus) from further slices from the same baguette. The moisture contents of the cores were determined by oven drying and mean spectra were calculated for the corresponding regions in the hyperspectral images. The calibration was developed from these data using modified partial least squares (MPLS) regression and then applied to the images to quantify the moisture distribution at all points in the slices (Figure 3). The baguettes prior to bake-off (labelled unbaked in Figure 3, see page 37) had a uniform moisture content due to the equilibration of moisture during storage after the initial part-baking operation. Following the final bake, drying of the outer part of the baguette is evident as would be expected. It is interesting to note, however, that there is some evidence of a ring of increased moisture content immediately underneath the outer drier zone. It is thought that this may represent moisture which has been carried further into the product as steam during or after baking. With subsequent storage, a progressive loss of moisture within the product may be seen resulting in a very dry (and very firm) baguette after 96 hours storage at 80 per cent R.H. Having established a working calibration, the technique may now be applied to other bread products to determine the relative importance of moisture migration and drying in the retention of product quality during shelf-life. Having established the underlying principles of the technique in this area, further work may also be undertaken to develop the appropriate calibrations for use in other food matrices, including composite food products.
Analysis of fat uptake in fried foods
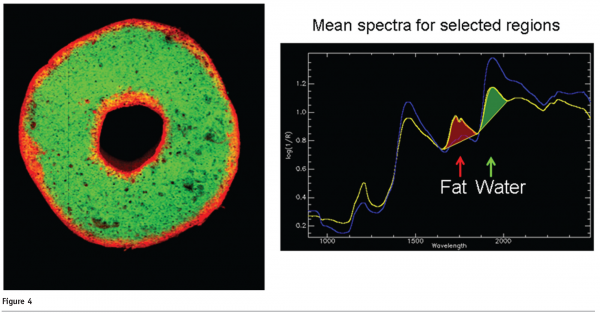
There are important health considerations related to high levels of human dietary intake of fat. As a result, food processors focus on ways to reduce the final fat content of a wide range of products. Fried foods are obvious targets for product development, as the characteristic texture and flavour are a function of frying, a process which also results in elevated fat contents. When assessing the uptake of fat in foods during and following frying operations, analysis of total fat content is relatively straightforward but determining the distribution of the fat in the food is considerably more challenging. This is relevant because the internal structure of many foods is likely to have an impact on fat uptake but quantifying the impact of structure on fat uptake patterns in a reliable and rapid way is currently difficult. To demonstrate the feasibility of using NIR hyperspectral imaging in this context, images have been acquired from a commercial doughnut. In this case, differences in spectral profile have been used to assess the regions of the doughnut having elevated levels of fat in a qualitative way. Example spectra for the peripheral and central regions of the doughnut are given in Figure 4, along with an image showing a false colour depiction of regions associated with higher levels of fat as well as those associated with higher levels of moisture. Areas under the relevant peaks for these components form the basis for the colour assignments. The outer regions, which are coloured red, represent those areas where fat has been taken up during frying, which would also be expected to be lower in moisture as a result of the frying process. Given that fat and moisture have separate and characteristic absorbance bands in the NIR region, calibrations may be developed to assess both the gradient of fat uptake as well as that for moisture. Given that the image also shows the internal structure of the doughnut, this finding illustrates the way in which the technique may be used to quantify compositional changes in both spatial and chemical contexts.
Determination of food ingredient properties in final products
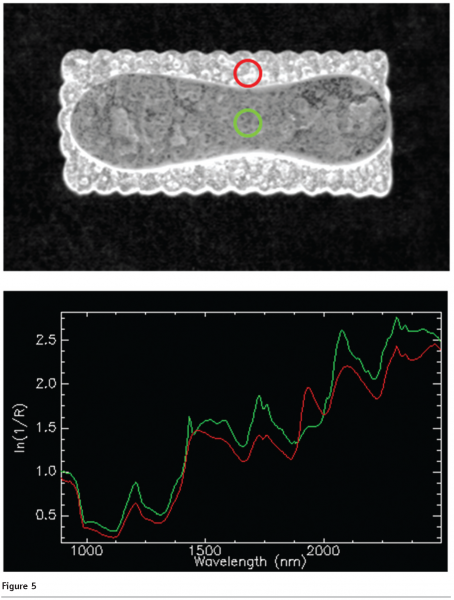
In addition to using calibration approaches to generate quantitative data, NIR imaging may also be used to assess food ingredient properties where identifiable spectral features exist. An example of such an approach is assessing the sugar properties within composite bakery or confectionery products. Figure 5 shows an NIR hyperspectral image from a commercial sandwich biscuit with the upper biscuit layer removed. The cream layer is thus clearly exposed on the surface of the lower biscuit layer. The monochrome image represents reflection at a single wavelength (1925 nanometres) and illustrates the basic structure of the biscuit. Mean spectra for the regions indicated by red and green circles are shown in the accompanying plot. The spectra for both components (biscuit and cream) contain information related to fat (1650-1800 nanometres, 2300-2400 nanometres) and carbohydrates (1400-1600 nanometres, 2000-2200 nanometres). However, the band for moisture (1900-2000 nanometres) is more prominent in the biscuit spectrum. In fact, there is very little evidence of moisture in the cream, illustrating that it is primarily a blend of fat and sugar. More interestingly, however, there is evidence of a sharp absorbance at 1435 nanometres which has been previously identified as being characteristic of crystalline sucrose (Davies and Miller, 1988). This is absent for the biscuit as the sugar in the recipe will have dissolved in the dough water during mixing. The cream appears, therefore, to be a blend of fat and crystalline sucrose which was produced without using water, a process which has allowed the characteristic spectrum of crystalline sucrose to remain apparent. Both NIR and image analysis are used as techniques to characterise and assess a wide range of food ingredients and products. The combination of the techniques now possible through the use of hyperspectral imaging gives a new and very powerful tool for use in the global agri-food industry. This article gives a number of illustrations of the technology and it is anticipated that work in this area will gain prominence over the coming years as it is adopted for product development and control of industrial processes. 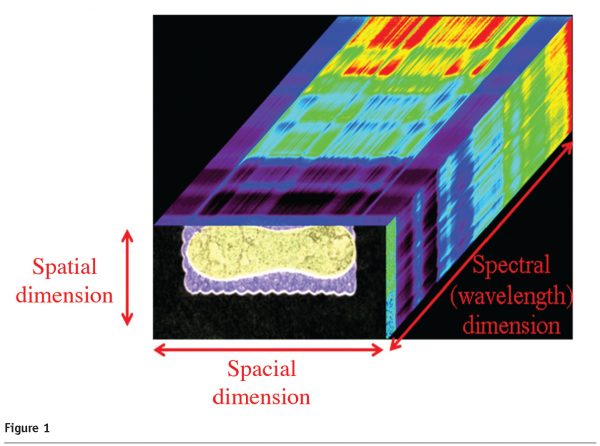





Reference
Davies, A.M.C. and Miller, C.E. (1988). Tentative assignment of the 1440-nm absorption band in the near-infrared spectrum of crystalline sucrose. Applied Spectroscopy, 42, 703-704.


