Monitoring the shelf life of dairy products
- Like
- Digg
- Del
- Tumblr
- VKontakte
- Buffer
- Love This
- Odnoklassniki
- Meneame
- Blogger
- Amazon
- Yahoo Mail
- Gmail
- AOL
- Newsvine
- HackerNews
- Evernote
- MySpace
- Mail.ru
- Viadeo
- Line
- Comments
- Yummly
- SMS
- Viber
- Telegram
- Subscribe
- Skype
- Facebook Messenger
- Kakao
- LiveJournal
- Yammer
- Edgar
- Fintel
- Mix
- Instapaper
- Copy Link
Posted: 6 November 2006 | Nicoletta Sinelli, Department of Food Science and Technology, University of Milano | No comments yet
The evaluation of shelf life of perishable foods is a key aspect of modern production and distribution. Food ‘freshness’ is one of the most required attributes by consumers and is strongly influenced by storage conditions – temperature abuse being one of the main factors affecting the shelf life (Labuza, 1982; Singh, 1994).
Fresh dairy products are ‘living’ products that continue to ripen during marketing, with a shift in chemical and sensory properties. An important commercial goal for soft and un-ripened dairy products is to keep them fresh i.e. to maintain some peculiar sensory characteristics such as a white and ‘brilliant’ colour, creamy visual texture and spreadability, milky aroma and flavour and low acidity. All these characteristics undergo slight changes during the early phases of the lipolytic and proteolytic processes caused by the natural microflora.
The evaluation of shelf life of perishable foods is a key aspect of modern production and distribution. Food ‘freshness’ is one of the most required attributes by consumers and is strongly influenced by storage conditions – temperature abuse being one of the main factors affecting the shelf life (Labuza, 1982; Singh, 1994). Fresh dairy products are ‘living’ products that continue to ripen during marketing, with a shift in chemical and sensory properties. An important commercial goal for soft and un-ripened dairy products is to keep them fresh i.e. to maintain some peculiar sensory characteristics such as a white and ‘brilliant’ colour, creamy visual texture and spreadability, milky aroma and flavour and low acidity. All these characteristics undergo slight changes during the early phases of the lipolytic and proteolytic processes caused by the natural microflora.
The evaluation of shelf life of perishable foods is a key aspect of modern production and distribution. Food ‘freshness’ is one of the most required attributes by consumers and is strongly influenced by storage conditions – temperature abuse being one of the main factors affecting the shelf life (Labuza, 1982; Singh, 1994). Fresh dairy products are ‘living’ products that continue to ripen during marketing, with a shift in chemical and sensory properties. An important commercial goal for soft and un-ripened dairy products is to keep them fresh i.e. to maintain some peculiar sensory characteristics such as a white and ‘brilliant’ colour, creamy visual texture and spreadability, milky aroma and flavour and low acidity. All these characteristics undergo slight changes during the early phases of the lipolytic and proteolytic processes caused by the natural microflora. The kinetics of the quality decay and the definition of an acceptability or stability time for marketing and storage of dairy products is achievable through traditional and innovative methods. Several studies have been carried out to monitor the shelf life of fresh dairy products by using chemical and physico-chemical indices (Lobato-Calleros and Aguirre-Mandujano, 2000; Toppino and Riva, 2003). These methods are generally time-consuming and complex for routine quality control. Among the transformations that take place during storage, visual modifications (colour, shape, structure) and flavour changes are particularly important as they can influence the choice of consumer, involving pre-judgement (Warburton, 2003). Image analysis and the evaluation of the odour profile by means of an electronic nose (EN) are techniques that allow the objective and rapid measurement of parameters that can be easily correlated to the shelf life of the dairy products. Recently, some works based on these innovative techniques have been proposed (Toppino et al., 2002; Toppino et al, 2004; Benedetti et al, 2005) and NIR spectroscopy has proved to be a powerful tool for research in agriculture, food, pharmaceutical, chemical and polymer industries (Williams and Norris, 2001). From its ability to analyse a wide range of chemical and physical properties of food samples with different technological characteristics in a rapid and non destructive way, NIR appears suitable for monitoring the shelf life of dairy products, offering competitive advantages to food manufacturers, reducing overall costs and improving product quality. The advantages of NIR spectroscopy are its speed (5-10 seconds for the analysis); simplicity of sample preparation and its non-destructive nature. Its greatest disadvantage is probably a weak sensitivity to minor constituents. The NIR analysis requires a calibration between spectral data and reference methods for the constituents of interest. Results published in the last five years show that NIR spectroscopy, in combination with multivariate statistical analyses, has broad applications in our understanding of food structure and properties (Karoui, et al, 2003). There has, however, been no application of this technique to shelf life studies. In this research NIR spectroscopy was applied as a rapid non-invasive method to some products, such as packed industrial Ricotta, Crescenza cheese and Italian butter, stored at constant temperature for different times in order to evaluate the shelf life of dairy products. In conjunction with this, traditional chemical and rheological indices of dairy product’s quality were evaluated.
NIR spectroscopy
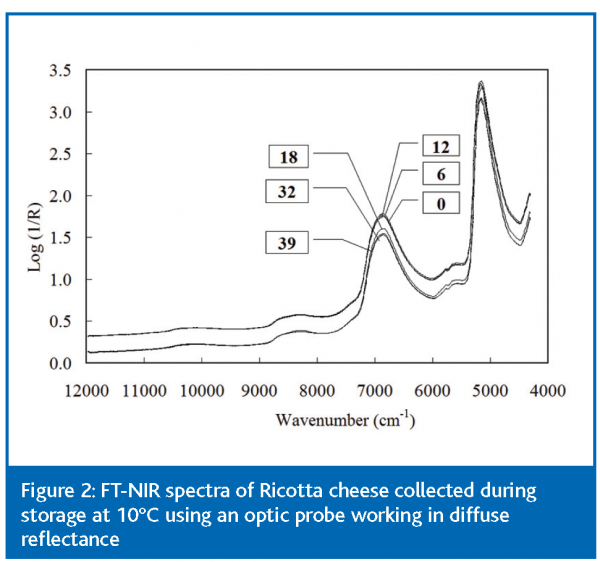
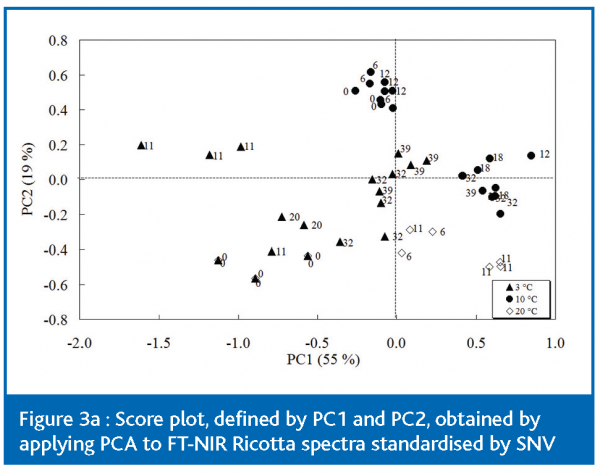
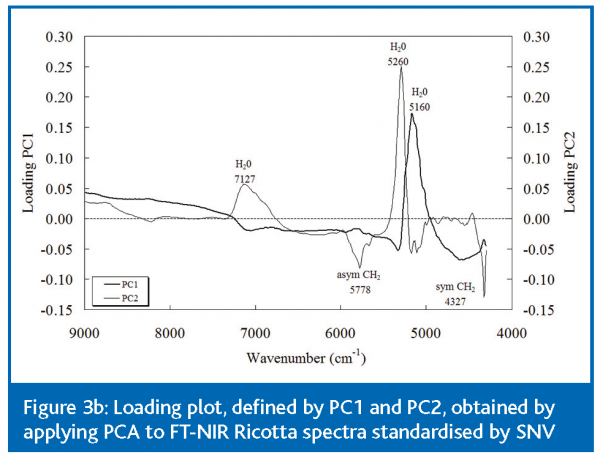
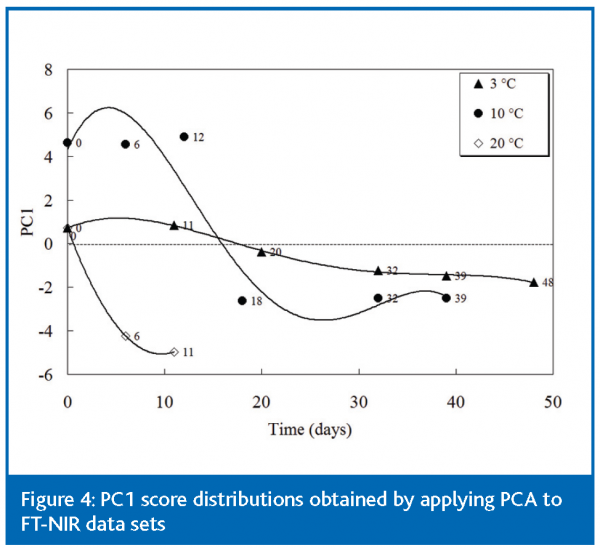
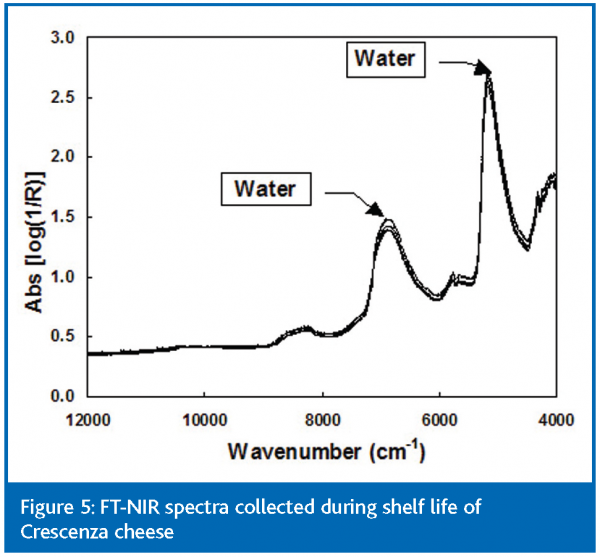
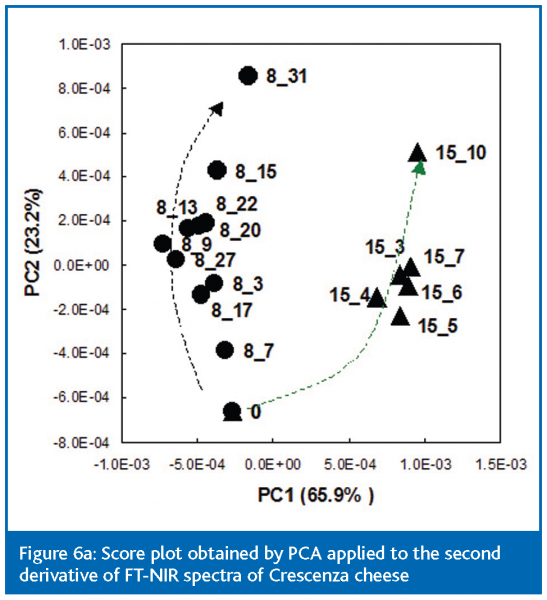
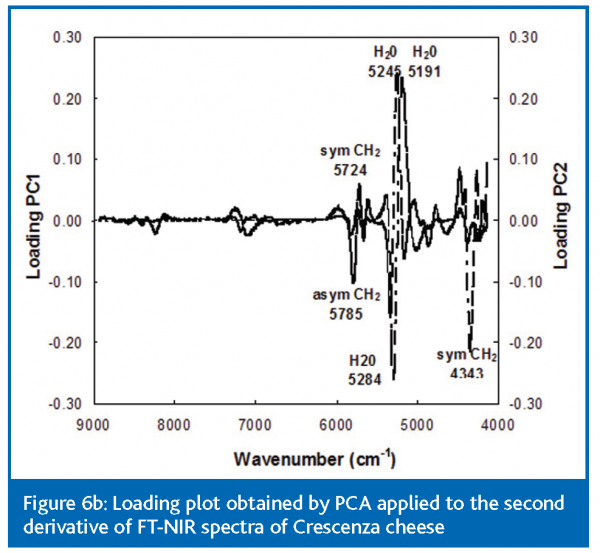
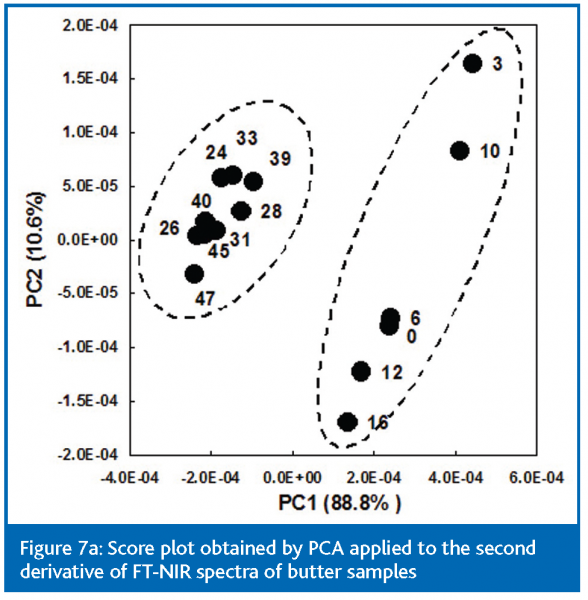
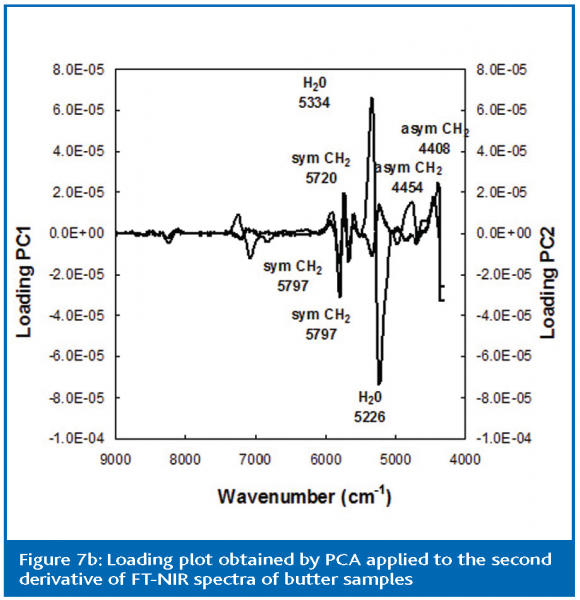
Analyses were performed with a FT-NIR Spectrometer (MPA, Bruker Optics, Milan, Italy) equipped with an optic probe working in diffuse reflectance. As shown in Figure 1, measurements were carried out in replicates (from 4 to 8), using the optic probe directly on dairy products, without any sample preparation. The reflectance spectral data were collected over the range 12000 – 4000 cm-1 (resolution: 16 cm-1, scanner velocity: 10 KHz, background: 64 scans, sample: 64 scans) and stored as log (1/R). Instrument control and spectral acquisition were performed using OPUS software (v. 5.5, Bruker Optics, Milan, Italy). All spectra were exported in JCAMP.DX format and performed using the software Unscrambler (v8; Camo, Trondheim, Norway) for chemometric analysis. Spectral data were pre-treated using a Standard Normal Variate (SNV) algorithm and the second derivative calculation (Savitzky-Golay method, number of smoothing points = 9). SNV has been applied to minimise the effect of baseline shift and other interferences that may impair multivariate calibrations. Principal Component Analysis (PCA) was applied to NIR spectral data as an exploratory chemometric technique to detect unusual or outlying samples and to uncover spectral trends occurring during shelf life evaluation of dairy products. PCA was performed using the covariance matrix of the spectral data. For the evaluation of the shelf life of dairy products commercial Ricotta (a) and Crecenza (b) cheese and Italian butter samples (c) were used. For each study, storage temperature was continuously monitored by means of a micro-recorder device (TB Econorma SAS). a) Evaluation of the shelf life of Ricotta cheese Ricotta cheese, taken directly from a manufacturing line, as a single package of 250 grams each, was analysed during storage at three different temperatures. The samples were produced in a large scale operation and were taken from one production line. One pool of samples was stored at a constant temperature of 10 + 1°C, the recommended storage temperature for both household and commercial chain storage, and was analysed every 6 days for a 39 day storage period. Other samples collected a few months later were divided in two subsets: one stored at 3 + 1°C, corresponding to the temperature of cold storage used at the industrial level, which was analysed every 10 days over a 48 day period; the other was stored at room temperature (20 + 1°C) and analysed after 6 and 11 days of storage, respectively. For every sampling, three packets were opened and used to perform chemical, physico-chemical, rheological and NIR analyses. Figure 2 shows an example of the spectra of Ricotta cheese collected during storage at 10°C using an optic probe working in diffuse reflectance. Each spectrum is the average of six replicates carried out on the same sample. FT-NIR spectra were characterised by two main peaks corresponding to the water absorption bands. Each set of FT-NIR spectra was standardised by SNV and PCA was applied as exploratory analysis to the covariance matrix. The PCA applied to the spectral data of packed industrial Ricotta cheese, stored at constant temperatures (3, 10, 20 °C) for different times confirmed the discriminating ability of the FT-NIR spectroscopy for monitoring shelf life. As can be seen in Figure 3a, the score plot defined by the first two Principal Components shows a satisfactory sample distribution according to the storage conditions. A threshold between ‘fresh’ and ‘old’ samples is also noticeable for each storage temperature, corresponding to 12-18 days of storage at 10°C, 29-32 days at 3°C and 24 hours of storage at 20°C. The score plot also shows a classification among Ricotta cheese samples produced in winter and in summer, offering a useful tool for identification of seasonal variations. In fact, taking account of the storage time, samples produced in summer (10°C) are distributed on the plane along PC2 from the top to the bottom (19% of the total variance), while the other samples, made in winter (3° and 20°C), are distributed along PC1 (55% of the total variance) from the left to the right. The loading weights, PC1 and PC2, plotted against wavenumbers (Figure 3b) shows that water and fat vary during Ricotta cheese storage. In particular, varying wave numbers are 7127 cm-1, corresponding to the first overtone of O-H symmetric and asymmetric stretching of water interaction with fats; 5260 and 5160 cm-1, corresponding to O-H bending and asymmetric stretching combination band of water; 5778 and 4327 cm-1, corresponding to the first overtone of the C-H asymmetric stretching of CH2, and the combination band of the C-H asymmetric stretching and bending of CH2 of the aliphatic chains of the lipid, respectively (Sasvic, & Ozaki, 2000). Variations in these absorption bands can be related to the reorganisation of water and fat that occurs during cheese storage. During storage, water and fat undergo structural modifications in order to maintain the delicate equilibrium of the native structure. Water and fat interactions are necessary to maintain a stable whey protein network, thus preventing the collapse of Ricotta cheese structure during shelf life. In order to obtain a critical day for cheese shelf life, the PC1 scores were plotted against storage time. The PCs score plot (Figure 4) showed the possibility to obtain a good sample distribution along the PC1, according to the increase of storage time, and that a critical day for shelf life of the product existed for each storage temperature. Storage beyond this point results in a product that is no longer acceptable. This critical day was reflected in the physical-chemical, rheological and spectroscopic variations, demonstrating the relationship between the different techniques used (Sinelli et al, 2005). b) Evaluation of the shelf life of Crescenza cheese Two packs of Crescenza cheese (250 g), directly supplied by a manufacturer at the beginning of their commercial life, were stored under constant temperature conditions at 8° and 15°C in the original paper packaging. Samples stored at 8 + 1°C and at 15 + 1°C were analysed every three days over a 31-day period and every day for a 10-day period, respectively. For every sampling, three packets were opened and used to perform chemical and physico-chemical, rheological and NIR analyses. Figure 5 shows an example of NIR spectra collected by an optic probe working in diffuse reflectance, placed directly onto the original packages of Crescenza cheese during storage at 8°C. To give prominence to differences among spectra, the second derivative of the absorbance values were computed. The score plot obtained by PCA (Figure 6a) allowed a satisfactory sample distribution for each sampling. Samples were distributed along PC1 according to different storage temperatures and along PC2 according to storage time. FT-NIR spectroscopy was able to describe the influence of storage time on shelf life of Crescenza cheese, but it was not able to identify a threshold of shelf life, dividing samples into ‘fresh’ and ‘old’. In a parallel study (Giardina et al, 2004), in which two different storage temperatures were considered separately (10 and 8°C), the FT-NIR was able to identify a threshold of shelf life, corresponding to 6-7 days for samples stored at a lower temperature and 3-4 days for samples stored at a higher one. Plotting the loading values of PC1 and PC2 against wavenumbers (Figure 6b), water and fat absorption bands (Svasvic´, & Ozaki, 2000) appear to be responsible for sample distribution, being related to modifications of the state of water and fat that occurs during cheese ripening. These two principal components describe the structure modifications necessary to establish an equilibrium of forces to maintain the case in network stability and to avoid structural collapse. The protein role was not identifiable by NIR because protein bands were overlapped by water absorption bands These results corresponded well with those obtained in another work, in which the shelf life of Crescenza was studied by physico-chemical tests (Riva et al, 1997), and with those obtained by using the electronic nose (Benedetti et al., 2005). c) Evaluation of the shelf life of Italian Butter sample Italian Butter samples (250 g), made from sour cream and taken directly from the manufacturer, were stored at a constant temperature of 10 + 1°C. The PCA, combined with a Cluster analysis, was able to discriminate between ‘fresh’ and ‘old’ samples after two-three weeks of storage (Figure 7a), demonstrating the feasibility of NIR in evaluating the shelf life of butter. The loading plot showed the bands mainly involved in sample identification, corresponding to the association between fat and water (Sasvic, & Ozaki, 2000), both involved in the oxidation reactions (Figure 7b). Also in this case study, the critical day of shelf life, measured by NIR, corresponded well with those obtained by chemical and physico-chemical analyses (pH, ammonia content and peroxide value) and by electronic nose (Riva et al, 2004). In conclusion, the results of these case studies proved that NIR spectroscopy could be applied for the prediction of shelf life of dairy products – being able to rapidly draw a profile of the product relating to its total quality. In each case study, the obtained results were in good agreement with those reported both with physical-chemical tests and the electronic nose. This technique also facilitated monitoring of quality trends in Ricotta cheese, Crescenza cheese and butter sample during storage at different temperatures, suggesting that NIR could be a promising technique for other dairy products. The model used in this study could also be adapted to monitor and evaluate the shelf-life of similar dairy products. Overall, these results show that NIR spectroscopy, being a non-destructive method, could be implemented in conventional techniques to predict quality chemical-physical modifications involved during a process and could also be used to monitor these or similar processes as on-line sensors. 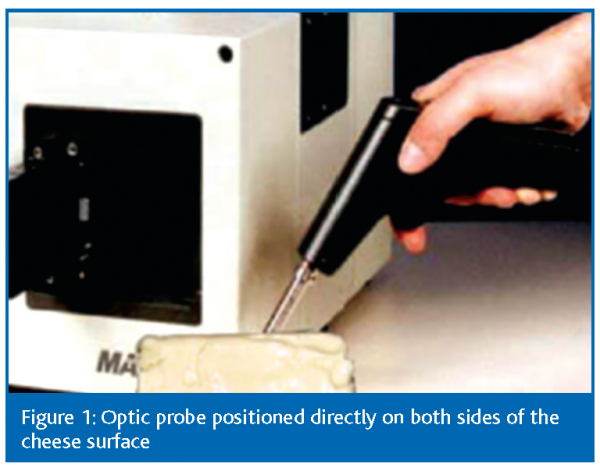










References
Benedetti, S., Sinelli N., Buratti, S., Riva, M. 2005. Shelf life of Cresenza Cheese as Measured by Electronic Nose. J. Dairy Sci., 88, 3044-3051. Giardina C., Sinelli N, Giangiacomo R. and Cattaneo T.M.P. 2004. Il formaggio crescenza: studio dell’effetto della temperatura di conservazione sulla durabilità di prodotto mediante spettroscopia FT-NIR; Proceedings of the National Symposium NIR-2004, Lodi, 15-16/06/2004. Karoui, R., Mazerolles, G., & Dufour, E.. 2003. Spectroscopic techniques coupled with chemometric tools for structure and texture determinations in dairy products. International Dairy Journal, 13, 607-620. Labuza, T. P. 1982. Scientific evaluation of shelf life. Pages 41-44. in T.P. Labuza, Shelf-life dating of foods, ed. Food & Nutrition Press Inc., Westport, USA. Lobato-Calleros, C., and E. Aguirre-Mandujano. 2000. Viscoelastic properties of white fresh cheese filled with sodium caseinate. J. Texture Stud. 31:379-390. Riva, M., S. Benedetti, and N. Sinelli. 2004. Tecniche combinate NIRS e Naso Elettronico per lo studio della shelf life di prodotti lattiero-caseari. Ingredienti Alimentari III :19-24. Riva, M., Toppino, P.M., & Premazzi, A. 1997. Studio e monitoraggio mediante un dispositivo TTI della shelf-life della Crescenza. Scienza e Tecnica Lattiero-Casearia. 48(3), 311-323. Sinelli, N., Barzaghi, S., Giardina, C., Cattaneo T.M.P. 2005. Use of the FT-NIR spectroscopy to monitor the shelf-life of packed industrial Ricotta cheese. J. Near Infrared Spectroscopy, 13, 293-300. Singh, R. P. 1994. Scientific principles of shelf life evaluation. Pages 3-26 in C.M.D. Man and A.A. Jones, Shelf-life evaluation of foods, ed. Blackie Acad.and Prof, London, UK. Toppino, P. M, L. Campagnol, D. Carminati, G. Mucchetti, M. Povolo, S. Benedetti, and M. Riva. 2004. Shelf life study of packed industrial ricotta cheese. In Special issue of It. J. Food Sci., Chiriotti ed., Pinerolo, Italy, pp. 252-265. Toppino, P. M., and M. Riva. 2003. Studio della predizione della shelf life dei formaggi. Sci. Tecn. Latt. Cas. 54:237-265. Toppino, P. M., M. Riva, A. Cigoli, and G. Civardi. 2002. Studio della shelf-life del formaggio Taleggio confezionato: 1. Valutazione convenzionale e monitoraggio mediante un dispositivo TTI. Sci. Tecn. Latt-Cas. 53:81-106. Warburton, D. 2003. The pleasure process. Food Sci. Technol. 17:36-37. Williams P. and Norris K. 2001. Near-Infrared Technology in the Agricultural and Food In-dustries, 2nd edition, American Association of Cereal Chemists, St. Paul, Minnesota, USA.


