Measuring meat colour
Posted: 6 November 2006 | Bruce W. Moss, Agri-Food & Biosciences Institute, Northern Ireland | No comments yet
When fresh food is purchased it may be possible to obtain a small sample for tasting, for example, cheese at a dairy counter. In the majority of cases, however, the only indicator of final eating quality is the appearance of the food. Consumers have associations based on previous experience, for example red apples tend to be soft textured and sweet whereas green apples tend to be crisp and sour. The consumer may also be aware of blemishes or other marks which give an indication of freshness. If the food supplier could obtain an indicator of quality from appearance this would be highly desirable.
When fresh food is purchased it may be possible to obtain a small sample for tasting, for example, cheese at a dairy counter. In the majority of cases, however, the only indicator of final eating quality is the appearance of the food. Consumers have associations based on previous experience, for example red apples tend to be soft textured and sweet whereas green apples tend to be crisp and sour. The consumer may also be aware of blemishes or other marks which give an indication of freshness. If the food supplier could obtain an indicator of quality from appearance this would be highly desirable.
When fresh food is purchased it may be possible to obtain a small sample for tasting, for example, cheese at a dairy counter. In the majority of cases, however, the only indicator of final eating quality is the appearance of the food. Consumers have associations based on previous experience, for example red apples tend to be soft textured and sweet whereas green apples tend to be crisp and sour. The consumer may also be aware of blemishes or other marks which give an indication of freshness. If the food supplier could obtain an indicator of quality from appearance this would be highly desirable.
Appearance and colour
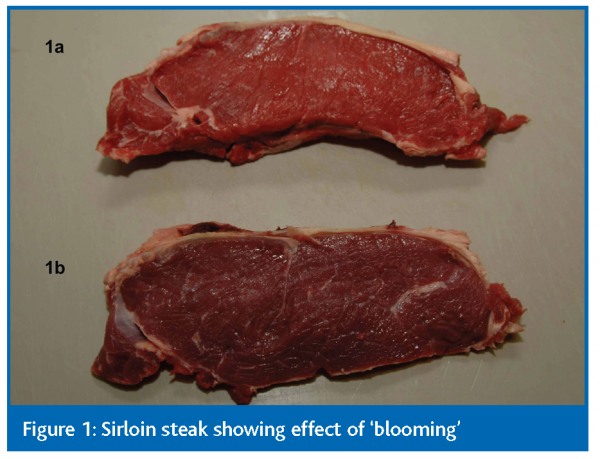
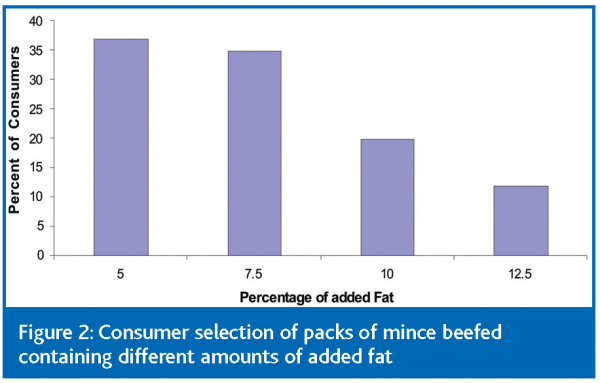
The concept of total appearance developed by Hutchings (2002) is that the sight of food generates expectations including various aspects of food safety and quality. For example, looking at a piece of steak (Figures 1a and 1b) consumers would identify it as beef and might consider how much fat was on the outside. They may also be interested in the amount of fat within the lean portion of the meat – the so-called ‘marbling fat’ – and might furthermore consider sample 1b to be less fresh. From these visual clues they will have certain expectations about the quality of the beef when it is cooked and consumed. Sensory tests have shown that panelists were able to distinguish between samples of mince beef that differed in fat content by only 2.5 per cent added fat (Figure 2).
Most consumers generally prefer ‘bright red’ beef, since they associate this with freshness (Figure 1a). Current packaging systems such as modified atmosphere packaging (MAP) aim to prolong the shelf life of the meat both by retaining an acceptable colour and reducing microbial spoilage. Colour is one aspect of appearance and depends not just on the properties of the object, the meat in this case, but also the type of light under which the product is being viewed. The international system for colour measurement CIE (Commission Internationale d’Léclairage) takes into account lighting conditions.
The colour of meat
The colour of meat depends on the amount of haem pigment (myoglobin) present, the state of the pigment and the scattering properties of the meat. A freshly cut surface of meat appears purple (Figure 1b) since the predominant state of the pigment is the reduced form (reduced myoglobin). Once opened to air, however, the beef will ‘bloom’ and appear ‘bright red’ as the predominant state of the pigment is now oxymyoglobin (Figure 1a). This change must be taken into account when measuring meat colour and can be critical when considering the colour of beef in packaged systems. Is the measured colour of the meat out of the pack a true representation of the colour that the consumer sees when it is in the package?
Little colour change would occur upon opening a modified atmosphere pack, however, opening one of the retail vacuum packs would certainly result in colour change. The pigment in the meat in the vacuum package would be reduced myoglobin but once opened would be expected to ‘bloom up’ to oxymyoglobin. The measurement of colour immediately after opening, to minimise the blooming effect, will not necessarily be a true representation of what the consumer sees. The consumer is, in the case of a skin vacuum packaged product, essentially viewing a product which consists of the packaging film, a thin layer of exudate from the meat and then the meat. Although the packaging film appears optically clear to the eye it may have light transmission properties which are not uniform over the visible spectrum.
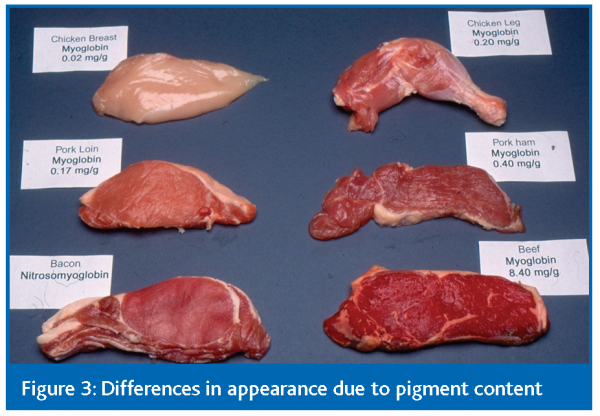
The effect of blooming is visually obvious for beef. However, cutting through a piece of beef perpendicular to the exposed bloomed surface will generally show that the ‘bright red’ oxymyoglobin is only present for a few millimetres below the surface. Pork and chicken breast muscle show little visual evidence of blooming and instrumental measurements show little evidence of oxymyoglobin formation in chicken breast muscle (Millar et al 1993). Differences between the colour of beef, pork and chicken are largely due to differences in pigment concentration (Figure 3).
The light scattering properties of meat are also important as two meat quality problems arise from changes in the light scattering properties of meat. Pale soft exudative (PSE) pork is associated with an increase in light scattering; resulting from denaturation of sarcoplasmic proteins as a result of a rapid pH fall post mortem. When the pH of the meat does not fall to its normal ultimate level of 5.5 but remains above pH 6.0 the meat is referred to as dark firm and dry (DFD). In this case the light scattering within the meat is less and there are also additional biochemical changes. Such meat when cut does not ‘bloom up’ and is also referred to as dark cutting beef.
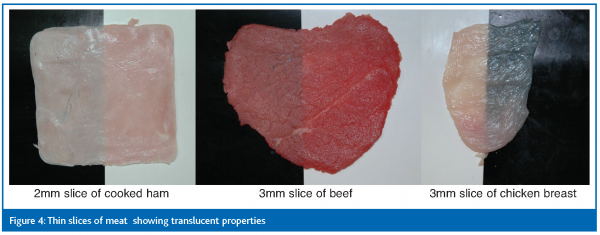
Meat is translucent and thin slices appear visually different depending on the colour of the surface on which they are placed (Figure 4). It has been shown for pork that a sample for colour measurement needs to be at least 2 cm thick so that the colour measurement is not influenced by background colour. This is referred to as ‘infinite thickness’ when taking reflectance measurements to determine colour values. Increasing the light scattering of the meat (e.g. PSE pork) reduces the infinite thickness and decreasing light scattering increases the infinite thickness. Chicken breast meat that has a low myoglobin content requires a thicker slice for reflectance measurement than beef with its higher myoglobin content. Differences in the instrumentation used for colour measurement will affect the ability to discriminate between DFD and PSE meat.
Colour measurement
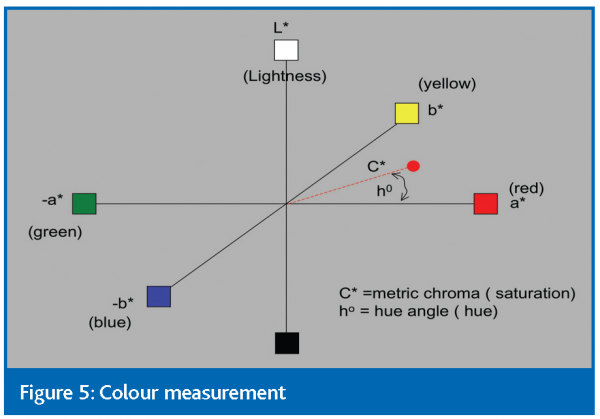
Colour is defined in three-dimensional space where the vertical axis defines lightness and the saturation and hue are given in a plane perpendicular to the lightness axis (Figure 5). The most commonly used system for describing food colour is the CIELAB system, where L* describes lightness, a* redness (-ve a* = greenness) and b* = yellowness (-ve b* = blueness). To quantify colour in the CIE system, a reflectance spectrum of the meat is obtained (from 380nm to 780nm) using recognised CIE measurement geometry. From these reflectance values CIELAB values can be calculated for a specific illuminant. Illuminant D65 is representative of daylight and is most commonly used for specifying CIELAB values of food. To relate measured CIELAB values to retail display conditions it may be better to specify the CIELAB values for illuminant A (Tungsten lamp bulb) or 83 (triband fluorescent lamp), since the latter more closely resembles the background lighting used in supermarkets (MacDougall 2002).
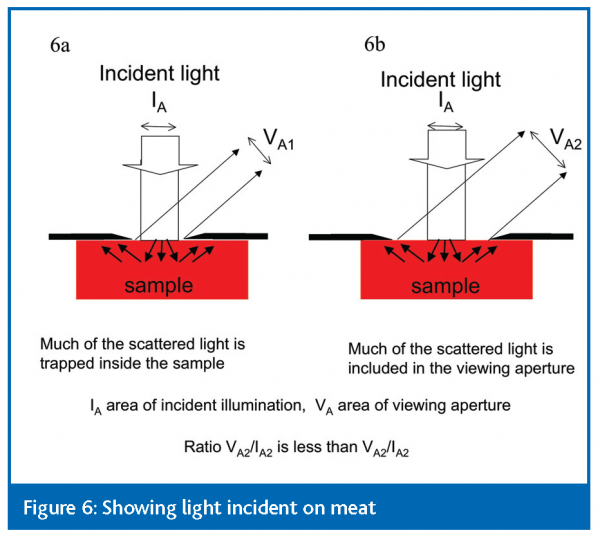
Instruments used for colour measurement have measurement conditions according to CIE recommendations. To calibrate reflectance spectrophotometers a range of ceramic gloss or matt tiles or SpectralonR discs, calibrated to reference national standards, are available (National Physical Laboratory, UK; NIST, USA). Variation between instruments, even when similarly calibrated, can occur due to the relative ratio of the area of the viewing aperture to the illuminating light spot. This is a major problem when measuring the reflectance of translucent materials such as milk and meat (MacDougall 1987). Light incident on a translucent object, such as meat, is both reflected from the meat surface and scattered within the meat. If the area of viewing is small relative to the area of illumination then much of the scattered light would be trapped inside the sample and not included in the reflectance measurement (Figure 6a). If, however, the viewing area is large relative to the illumination area then the scattered light would be included in the reflectance measurement (Figure 6b).
In a comparison of instruments and viewing geometry it was found that although there was good correlation between the colour values obtained for opaque reference materials, the correlation was poorer when used to measure the colour of chicken breasts. Part of this difference in CIELAB values between instruments with the same measurement geometry can be accounted for by the ratio of the area of viewing to the area of illumination (Millar et al 1995). The ratio of the area of illumination to the area of viewing is critical when one considers that the quality problems of PSE and DFD in meat are due to differences in the scattering properties of meat.
In order to obtain measurements of meat colour that relate to consumer acceptance, it is important to standardise calibration and viewing geometry – particularly the ratio of illumination to viewing aperture. To obtain a representative colour measurement for meat, the overall area of measurement should be sufficiently large. Care must be taken in selecting a suitable measuring instrument. If the aperture is small (i.e. 8mm or less) it is necessary to take several reflectance readings of each sample.
Meat discolouration and pigment state
When exposed to air, the ‘bright red’ oxymyoglobin pigment oxidises to the ‘brownish green’ metmyoglobin. Oxidation to metmyoglobin results in a decrease in a* (redness) and increase in b* (yellowness), with small changes in lightness (MacDougall 2002). Most reflectance instruments only give measurements at 10nm or 5nm intervals, however, with research instruments of higher wavelength resolution (e.g. 1nm) it is possible to calculate the proportion of the different types of pigment present (Krzywicki 1980). When 20 per cent of the oxymyoglobin on the surface of beef has been oxidised to metmyoglobin, it has been shown that consumers will reject it (Hood & Riordan 1973). In quality control it may be beneficial to use the spectral data directly rather than calculate CIELAB values. Irradiated pork could be distinguished from unirradiated pork when multivariate statistics were applied to the spectral reflectance data but not when applied to CIELAB values (Moss et al 2000).
Colour measurements on meat are not always the best guide to consumer rejection. A study on PSE chops at retail level showed that consumers preferred the paler pork, however, when on display for longer periods the same pale chops were rejected on the basis of the excessive drip loss visible in the pack. When absorbent pads are used in the packs, which would be current practice, consumers tend to prefer the paler pork (Moss et al 1992). There is a need to identify whether the pork is paler due to lower pigment content or due to PSE, since in the latter case there will be increased cooking loss and the pork will be less juicy when eaten.
Video imaging for quality control
Digital images can provide a means of quantifying colour and equipment is commercially available from which CIELAB coordinates can be obtained (Hutchings et al 2002). Such laboratory based equipment has carefully controlled lighting and calibration and is not suitable for field use. Colour problems that arise at retail or when the meat is packed are not always accurately described. When suitable samples are delivered to the laboratory, the method of transport and time delay can alter and exacerbate the nature of the colour problem. Digital images may provide a rapid means of colour communication. Provided the original digital image is obtained under relatively standard conditions with suitable calibration, the image could be electronically transmitted to the laboratory for detailed evaluation or compared against suitable quality control images. In the dental field digital imaging has been developed to enable better quality control and matching in prosthetic work. Although specialised camera equipment and software have been developed, it is possible to obtain good correlates between the CIELAB values obtained from digital images using relatively inexpensive cameras and readily available image editing software and CIELAB values from laboratory based spectrophotometers (Jarad et al 2005).
Summary
Maintaining the appearance of meat that is acceptable to the consumer is critical. Careful consideration must, however, be given to standardising the method of measurement and consequently interpretation of the results.






References
MacDougall, D.B. (2002). Colour measurement of food Chp 3 in Colour in Food improving quality. Ed. D.B. MacDougall. Woodhead Publishing Ltd.
Hutchings, J. (2002). The perception and sensory assessment of colour Chp 2 in Colour of Food, improving quality Ed. D.B. MacDougall, Woodhead Publishing Ltd.
Hutchings, J., Luo, R. and Ji, W. (2002). Calibrated colour imaging analysis of food, Chp 14 in Colour in Food, improving quality Ed. D.B. MacDougall, Woodhead Publishing Ltd.
Moss, B.W., Millar, S.J. and Kilpatrick, D. (2000). The use of discriminant analysis for the interpretation of the reflectance of irradiated porcine longissimus dorsi. Meat Science 55 (3) 337-348.
Millar, S.J., Moss, B.W., MacDougall, D.B. and Stevenson, M.H. (1995). The effect of ionising radiation on the CIELAB colour co-ordinates of chicken breast as measured by different instruments. Int. J. Food Science and Technology. 30, 663-674.
Krzywichi, K. (1979). Assessment of relative content of myoglobin, oxymyoglobin and metmyoglobin at the surface of beef. Meat Science, 3, 1-10.
Hood, D.E. and Riordan, E.B. (1973). Discolouration in prepacked beef – measurement by reflective spectrophotometry and shopper discrimination. J. Food Science and Technology 8, 333-343.
Jarad, F.D., Russell, M.D. and Moss, B.W. (2005). The use of digital imaging for colour matching and communication in dentistry. British Dental Journal, 199(1):43-49.
Millar, S.J., Wilson, R., Moss, B.W. and Ledward, D.A. (1993). Oxymyoglobin formation in meat and poultry. Meat Science, 36:397-406.
Moss, B.W. and Kilpatrick, D.J. (1992). The influence of appearance on consumer selection of pork chops. Agriculture in Northern Ireland, 6(15):16-17.
MacDougall, D.B. (1987) Optical measurement and visual assessment of translucent foods. In Physical Properties of Foods, Vol 2 Ed. R. Jowitt, F. Escher, M. Kent, B. McKenna & M. Roques. P 319-330, Elsevier, London
Issue
Related topics
Flavours & colours, Quality analysis & quality control (QA/QC)


