Innovative uses of NIR to improve baking
- Like
- Digg
- Del
- Tumblr
- VKontakte
- Buffer
- Love This
- Odnoklassniki
- Meneame
- Blogger
- Amazon
- Yahoo Mail
- Gmail
- AOL
- Newsvine
- HackerNews
- Evernote
- MySpace
- Mail.ru
- Viadeo
- Line
- Comments
- Yummly
- SMS
- Viber
- Telegram
- Subscribe
- Skype
- Facebook Messenger
- Kakao
- LiveJournal
- Yammer
- Edgar
- Fintel
- Mix
- Instapaper
- Copy Link
Posted: 21 November 2005 | Dr. Richard Dempster, American Institute of Baking | No comments yet
Near Infrared Reflection (NIR) is an established and valid measurement method for many specific compounds, (moisture, protein, fat, etc.) within the food industry. Recently, two ideas have emerged from the American Institute of Baking (AIB). The first is to use NIR to monitor processes and the second is to use NIR to predict the performance of flour in the bakery. This article will focus on how AIB is developing an NIR prototype to follow and/or predict dough development.
Near Infrared Reflection (NIR) is an established and valid measurement method for many specific compounds, (moisture, protein, fat, etc.) within the food industry. Recently, two ideas have emerged from the American Institute of Baking (AIB). The first is to use NIR to monitor processes and the second is to use NIR to predict the performance of flour in the bakery. This article will focus on how AIB is developing an NIR prototype to follow and/or predict dough development.
Near Infrared Reflection (NIR) is an established and valid measurement method for many specific compounds, (moisture, protein, fat, etc.) within the food industry. Recently, two ideas have emerged from the American Institute of Baking (AIB). The first is to use NIR to monitor processes and the second is to use NIR to predict the performance of flour in the bakery. This article will focus on how AIB is developing an NIR prototype to follow and/or predict dough development.
Monitoring processes generally requires a real time system as, in most cases, we are interested in the immediate result. If a process is progressing out of control it is important to know immediately and not an hour later, when the sensor’s response has been analysed. Real time NIR was not possible until the advent of the diode array, which was produced by Ed Stark of KES Analysis and manufactured by Perten Instruments in the early 1990s. In 1997 AIB purchased a diode array system in order to explore the possibility of following the development of bread dough.
The standard tools for developing calibrations such as those mentioned above are referred to as chemometrics. Chemometrics began as a set of statistical methods that were applied to chemical data. Today, chemometrics has become a discipline in which degrees are earned and research papers abound. Unfortunately, these tools failed to produce a calibration that could identify the stage at which dough was developed. Therefore, late in 2001 the use of chemometrics methods was abandoned and research was directed toward developing a new approach to the dough development problem.
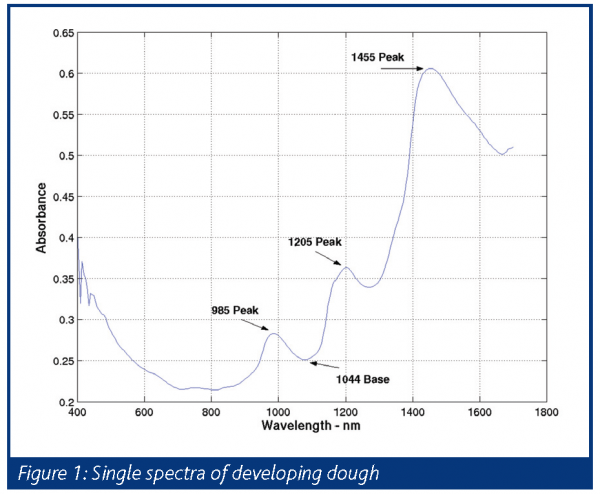
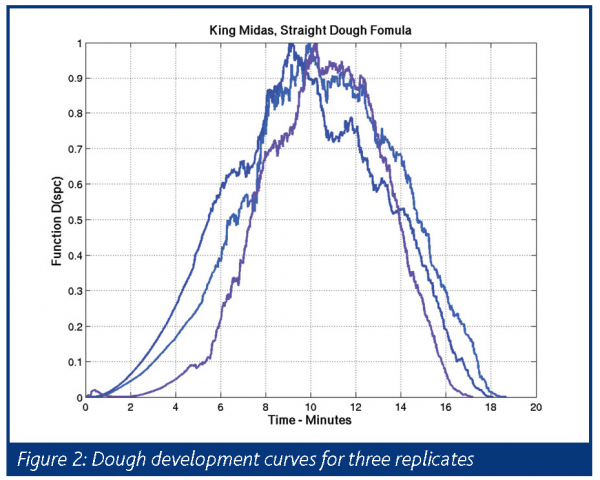
Using Matlab, purchased from Mathworks Inc., to visualise the data, a subtle relationship was identified. Using this information, an algorithm was developed and tested and found to be quite promising. The relationship between peaks at 1205 and 1455, in Figure 1, was found to follow dough development. Therefore, a program was written for Matlab enabling them to capitalise on this relationship. The output of this program is a development curve similar to Figure 2. In this figure, three replications using the same flour and procedure were run to test the repeatability of the program. As can be seen in Figure 2, the replications are very close to each other and well within the variability of a mixer operator.
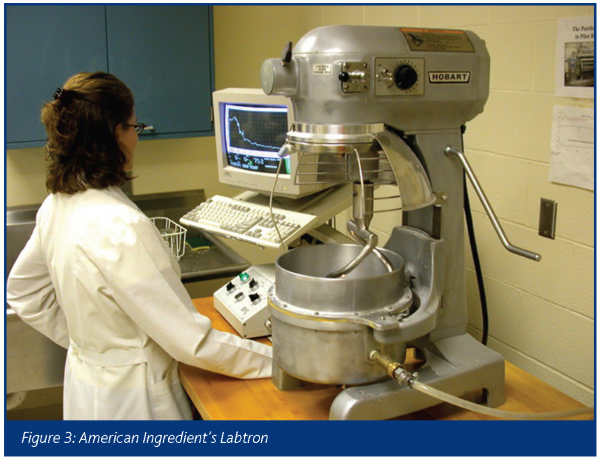
The experiment that produced these results was set up in the following way. First we needed a mixer and some current method for determining dough development. For this we used a Labtron from American Ingredients (Figure 3) – a laboratory mixing station consisting of the following: a Hobart A200 mixer with a McDuffee bowl (a bench top water cooled bowl); a torque sensor that is fed into a computer system capable of converting the reading to a graphic chart on the monitor, and a cooling system to provide chilled water to the McDuffee bowl. The traditional mixing attachment was replaced with a spiral mixing attachment that was found to impart more energy per unit time into the dough.
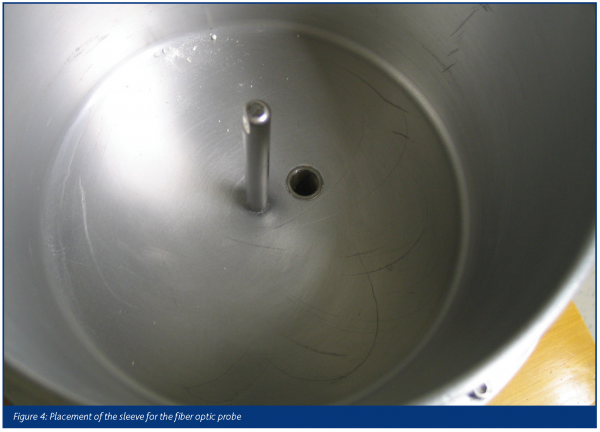
The purchase of the Perten diode array included a fiber optic probe. A hole was drilled into the bottom of the McDuffee bowl and a sleeve was inserted and sealed. The sleeve was designed so that the fiber optic probe could be slid into it. Figure 4 shows the placement of the sleeve, which allows enough room to place a reflectance standard in the mixing bowl. The fiber optic probe is inserted into the sleeve until it hits a 1/8-inch spacer, which we found to be necessary to allow the light from the fiber optics to interact with the dough.
The Perten diode array was set up to continuously grab and save the spectra to disk as, quite often, there would be over 3000 spectra per run. The basic procedure was to place the flour in first followed by the other dry or solid ingredients. The diode array was turned on 15 seconds before the water was added. The mixer was in progress as soon as the water was added and was allowed to run for approximately 20 minutes as, for most of the flours, the actual dough development time was unknown. Therefore, the mix time was set long enough to ensure that peak dough development would be captured during acquisition of the spectra. Figure 5 represents the spectra from one run. From this figure, there appears to be errant spectra and these can be associated with ‘clean up’ during the mixing process. During ‘clean up’ there are instances where the dough separates from the bottom of the mixer which changes the path length of the light. These errant spectra must be removed from the data before processing the good spectra.
Following removal of the errant spectra, the resulting data is processed through the Matlab program. The results are then plotted yielding the graph of Figure 2. At present the results are not in real time and research into developing a real time algorithm is continuing, however there has been enormous interest in using this outlined method as a research tool.
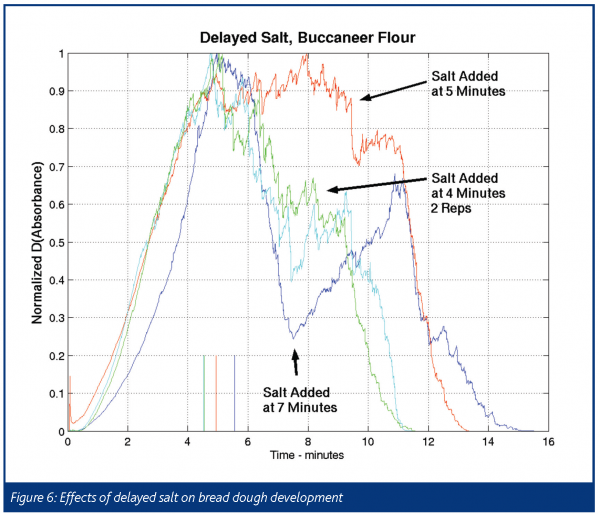
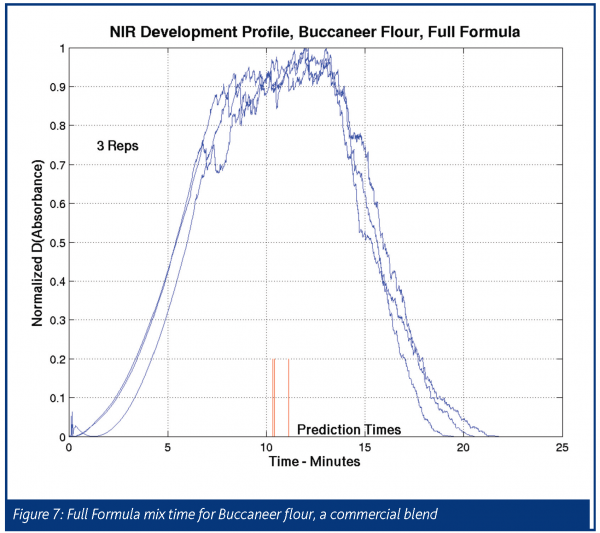
Figure 6 demonstrates the ability of this research tool to illustrate several rules of thumb used by the experienced mixer operator. The first rule of thumb is mixing time can be reduced by delaying the addition of salt until one minute before peak development occurs. In this case the reduction of mix time was 50 per cent, as the full formula mix time can be seen in Figure 7. The development time of the full formula dough is between 10 and 13 minutes, but the same formula with salt delayed was only 5 minutes. Not all flours will be reduced by 50 per cent, but a reduction in mixed time is well known in the industry. In Figure 6, two replications were conducted where the salt was added one minute before peak development. The results of both replications yielded no increase in dough development time and can be compared to the plot of the salt addition at 7 minutes past peak development, which peaked at 5 minutes.
The 7 minute delayed salt addition illustrates another rule of thumb, which is that the addition of salt past peak development will ‘tighten up’ the dough. This ‘tightening up’ can be seen as the plot begins rising at the time of salt addition. The final plot within Figure 6 is the addition of salt at peak development. The rule of thumb illustrated here is that dough at peak development can be held at peak for a longer period of time. Of course, the goal of this research is to produce a dough that never requires ‘fixing’. Researchers often dismiss rules-of-thumb, but in my conversations with mixer operators such rules persisted. For this research, I used the information gathered from experts to validate the NIR mixer research.
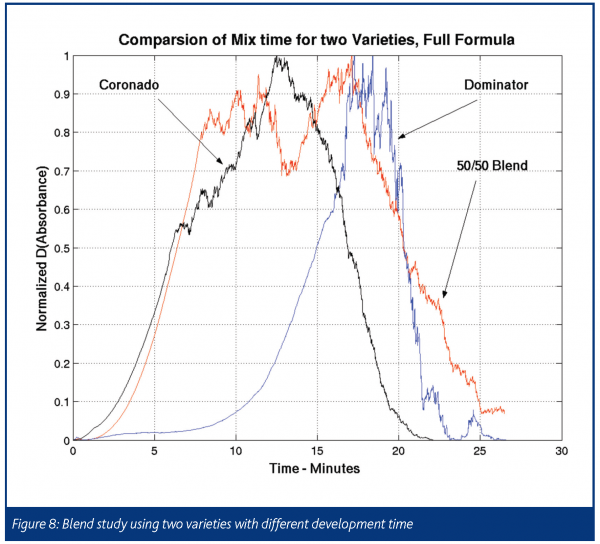
Another interesting result was produced from testing different varieties of wheat for development characteristics. In this blending study a variety of wheat with a long mix time was blended with a variety of wheat with a substantially shorter mix time. The results of this study (Figure 8 ) were surprising and did not produce the long peak time between two peak times of the individual varieties that were expected. Instead, as Figure 8 illustrates, blending did not occur. The first variety peaked at approximately the same time as when mixed by itself – as did the second variety. However, our concern was with the commercial varieties and discovering at what which point peak development occurs. Commercial varieties are blends of up to ten different varieties. The flour used in Figure 7 is a commercial variety that clearly shows a wide peak time. Figure 8 suggests that blending does not produce a uniform mixture and that some varieties in the blend are actually breaking down while others are not fully developed. The ratio depends on when the mixer operator stops mixing.
The horizontal line at the bottom of the plots in Figures 7 and 8 are a test of a prediction algorithm that is being investigated at AIB. This involves analysis of the data between 3 and 4 minutes into mixing and predicting the point at which peak development will occur. This will be necessary in order to practice delay salt addition. Being able to predict peak development has additional practical uses, such as automation and management of line time. This is still very experimental and only works on well-behaved doughs, but fails on short mix time and very long mix time varieties. For this reason a new algorithm is being developed that will be more responsive to time instead of using a fixed time.
The results from the two examples presented demonstrate the research potential of an NIR mixer and the need to fully understand the mixing process of blended varieties. At present research continues using the current algorithm to explore some of the issues presented here. However, there is a need for a mixer that can indicate or predict peak development in order to continue to improve dough consistency and automation in the baking industry.
