Food imaging
- Like
- Digg
- Del
- Tumblr
- VKontakte
- Buffer
- Love This
- Odnoklassniki
- Meneame
- Blogger
- Amazon
- Yahoo Mail
- Gmail
- AOL
- Newsvine
- HackerNews
- Evernote
- MySpace
- Mail.ru
- Viadeo
- Line
- Comments
- Yummly
- SMS
- Viber
- Telegram
- Subscribe
- Skype
- Facebook Messenger
- Kakao
- LiveJournal
- Yammer
- Edgar
- Fintel
- Mix
- Instapaper
- Copy Link
Posted: 31 January 2005 | Paul D A Pudney, Measurement Science, Unilever R&D Colworth Laboratory | No comments yet
In trying to understand the functionality of food materials, the microstructure has been universally recognised as important – hence the wide use of various forms of microscopy in food science.
Conventional light microscopy is well developed and widely used in characterising food structures (J.G.Vaughan 1979). The next level of information required is ingredient location within the observed optical structure. Some ingredient location can be obtained by using confocal laser scanning microscopy with component specific dyes. Although this is an extremely useful method, it is not universally applicable to all ingredients and, in many cases, we would like to go beyond this. Thus, a method is required that is sensitive to all the different ingredients, i.e. molecular components present in foods, and also, ideally, gives concentration information. This must be carried out in-situ and on the micron scale – a great challenge.
In trying to understand the functionality of food materials, the microstructure has been universally recognised as important – hence the wide use of various forms of microscopy in food science. Conventional light microscopy is well developed and widely used in characterising food structures (J.G.Vaughan 1979). The next level of information required is ingredient location within the observed optical structure. Some ingredient location can be obtained by using confocal laser scanning microscopy with component specific dyes. Although this is an extremely useful method, it is not universally applicable to all ingredients and, in many cases, we would like to go beyond this. Thus, a method is required that is sensitive to all the different ingredients, i.e. molecular components present in foods, and also, ideally, gives concentration information. This must be carried out in-situ and on the micron scale – a great challenge.
In trying to understand the functionality of food materials, the microstructure has been universally recognised as important – hence the wide use of various forms of microscopy in food science.
Conventional light microscopy is well developed and widely used in characterising food structures (J.G.Vaughan 1979). The next level of information required is ingredient location within the observed optical structure. Some ingredient location can be obtained by using confocal laser scanning microscopy with component specific dyes. Although this is an extremely useful method, it is not universally applicable to all ingredients and, in many cases, we would like to go beyond this. Thus, a method is required that is sensitive to all the different ingredients, i.e. molecular components present in foods, and also, ideally, gives concentration information. This must be carried out in-situ and on the micron scale – a great challenge.
Raman spectroscopy is a well established molecular sensitive technique. It has a wide variety of applications in many areas of science and technology (J.M.Chalmers et al 2002), which results in hundreds, if not thousands, of papers being published each year. It is a vibrational spectroscopic technique, like its more well known sister method infrared spectroscopy. It thus looks at the vibrational energy of bonds in a molecule. As each molecule has a unique pattern of atoms and bonds, its spectrum will also be unique and can thus be used to identify it. Another property of Raman spectroscopy that can be very useful is that the signal is directly proportional to concentration. It thus has the potential to be quantitative. It can be used to characterise many aspects of molecular behaviour and interactions. These applications are far too wide and numerous to be covered in this article, but are written about in many texts and reviews (J.M.Chalmers 2002 and ref. therin). There have been some applications of Raman spectroscopy in food science (ECY LiChan 1996) and its useful properties have long been recognised in biological science (A.T.Tu 1982). Despite this, it can be argued that Raman spectroscopy has yet to reach its potential – especially in the area of food science. However, recently there have been many technical advances in spectrometer design that may help close the gap between its potential and use.
These advances include improvements in optics (e.g. holographic gratings and notch filters) and stable longer wavelength lasers to help avoid fluorescence problems. These improvements have led to the development of practical confocal Raman microscopes, which now allows the information content of a molecular spectroscopy to be collected microscopically (i.e. on the micron length scale). This means that Raman spectroscopy has the potential to answer the questions posed above. How this can and has been applied to food systems is best illustrated by some practical examples – three of which are described here.
Phase separated biopolymer structure
Structuring the aqueous phase of foods is most often achieved by using gelling biopolymers. The study of these is a science in itself. In foods the structures formed are often phase separated and kinetically trapped gelled structures, so observing and understanding this behaviour is a great challenge. Even within this type of system, it is most difficult to study when the biopolymers are all carbohydrates, as it is particularly difficult to distinguish between these by other methods.
Figure 1 contains a white-light microscopic image of gellan and κ-carrageenan in water – this is typical of a mixture of two carbohydrates. The κ-carrageenan and gellan are both present in an average concentration of two per cent. Note the faint circle in the middle of the white light image; this is a phase-separated particle. Using a confocal Raman microscope, however, we were able to quantitatively map the distribution of κ-carrageenan and gellan in the mixture. This is shown in Figure 2. They were constructed by acquiring Raman spectra in a grid pattern over the phase separated particle. One of the keys to constructing such images is being able to separate out the highly overlapping spectra of the two carbohydrates. To do this a form of chemometrics was used (Pudney et al 2002 and 2004) called multivariant curve resolution (MCR) to isolate pure factors that correspond to the spectra of κ-carrageenan and gellan. These are shown in figure 2. These spectral factors have related scores which have different spatial distributions over the area that was analysed in the image. These scores are then scaled relative to a concentration calibration of the two carbohydrates. Thus the Raman images shown are false-colour maps of the concentration calibrated scores. The Raman images also offer much greater contrast than the white-light image. A Raman image can also be overlaid on a white-light image to directly correlate spectral information to optical structures in the sample. The large region in the middle of the images in Figure 2 contains lower levels of κ-carrageenan and higher levels of gellan than the surrounding material. This has been done for more than one mixture of the two biopolymers and from this a phase diagram can be plotted (Pudney et al 2003).
Full product structure: a dairy spread
As an example of how very complex systems can be analysed using this method, a map of a dairy spread system is shown. It consists of fat; skimmed milk powder and whey protein; locust bean gum (LBG) and pectin. Several Raman maps were collected and these spectral data sets were added together and analysed using the MCR method. The main spectral factors produced are compared to the relevant spectra of the pure components in Figure 3. Concentration calibrations were not carried out in this case, as only semi-quantitative information on the system was required. The main components are clearly separated. Example images of the different components present along with the white light is given in Figure 4. The results are complex and so not fully discussed here, however it clearly demonstrates that full product structures can be characterised using this method.
Bioavailability of carotenoids
We have also applied confocal Raman microspectroscopy and imaging to examine the distribution of carotenoids in raw and cooked tomatoes and carrots (Pudney 2000). Carotenoids – essential nutrients as protective antioxidants and precursors to Vitamin A — are hydrophobic, highly conjugated long-chain isoprenoid molecules. They are found in raw tomatoes and carrots as crystals in sub-cellular organelles called chromoplasts and must be solubilised in order to be absorbed. Heating causes the cells to break down and the carotenoids to be solvated in lipid droplets. We are interested in the extent that cooking solvates the carotenoids and makes them available for absorption by the body. We examined a raw yellow-flesh tomato and then heated it in a microwave. Figure 5 contains a white-light image of the tomato after boiling. The carotenoids are solubilised within the yellow lipid droplets. We obtained Raman spectra of this system using the instrument described above.
The spectra of lutein in chloroform and in the lipid globule are similar and these spectra are different from that of crystalline lutein – most obviously by a shift in the ~1550cm-1 band, which strongly indicates that the lipid globule contains solvated lutein. Figure 6 contains two Raman maps of a raw yellow-flesh tomato. The image on the left shows the distribution of lycopene and that on the right shows the distribution of lutein. This shows how Raman spectroscopy can be used to distinguish between the crystalline (less bioavailable) and the lipid-solvated (more bioavailable) forms of these compounds and to map their distribution
Conclusion
This work demonstrates the utility of Confocal Raman microscopy for ingredient imaging of food products. It can simultaneously image all ingredients and the images can be made quantitative. This work shows Raman spectroscopy should have a great future in food research.
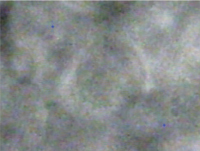

Figure 1: White-light image of a model product containing 2% gellan and 2% κ-carrageenan. The Raman data was collected between the blue dots
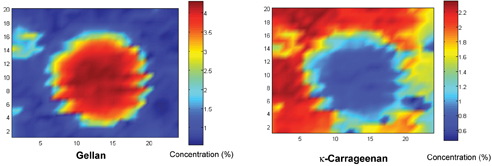

Figure 2: Raman images of the model product in Figure 1. The gellan is mainly concentrated in the large globule in the centre, while the k-carrageenan is found in the surrounding matrix. The axis units are microns (μm)
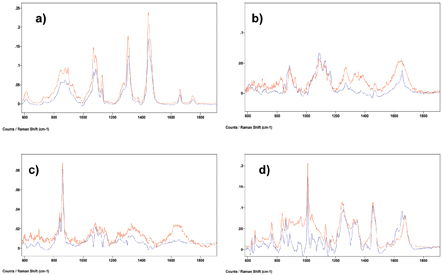

Figure 3: Comparison of spectra of standards (red) and MCR factors (blue) for a) fat, b) locust bean gum (LBG), c) pectin and d) a protein factor and b-lactoglobulin (one of the milk proteins). Factors obtained from microstructural Raman spectral maps of a dairy spread
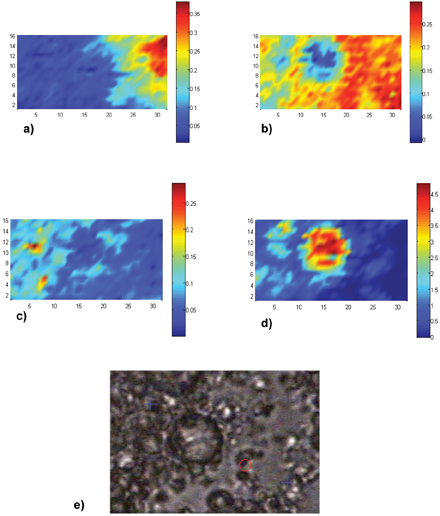

Figure 4: a)-d) False colour spatial images of main ingredient in a dairy spread. Scale on maps in microns. Colour scale bars show relative concentrations for each map. a) Pectin, b) LBG, c) protein and d) fat. e) optical microscope picture of the microstructure showing area that was mapped, indicated by the blue crosses


Figure 5: Lipid globules in cooked tomato
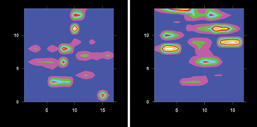

Figure 6: Raman maps of a raw yellow-flesh tomato. Left: lycopene. Right: lutein. The axis units are microns (μm)
References
J.G.Vaughan, Food Microscopy (1979) academic press
John Chalmers, Peter R. Griffiths, Handbook of Vibrational Spectroscopy (2002) Wiley
A.T.Tu, Raman spectroscopy in Biology (1982) John Wiley
ECY LiChan, The applications of Raman spectroscopy in food science
Trends In Food Science & Technology 7 (1996), 361-370
Paul.D.A.Pudney, Tom.M.Hancewicz, Dale.G. Cunningham, Michael.C.Brown, Quantifying the microstructures of soft solid materials by confocal Raman spectroscopy, Vibrational spectroscopy 34 (2004),123-135
P.D.A.Pudney, T.M.Hancewicz, D.G.Cunningham, The use of confocal Raman spectroscopy to characterise the microstructure of complex biomaterials: foods Spectroscopy 16 (2002), 217-225
P.D.A.Pudney, T. M. Hancewicz, D.G.Cunningham, C Gray Food Hydrocolloids, A novel method for measuring concentrations of phase separated biopolymers: The use of confocal Raman spectroscopy with self-modelling curve resolution 17 (2003), 345-353
P.D.A Pudney, L. Gambelli, M Gidley, Raman mapping of plant cells: carotenoids in tomatoes Proceedings of the 17th International Conference on Raman Spectroscopy, Beijing, China, August 20–25 (2000)


