Ingredients: Modulation of saliva flow, saliva lubricating properties and related lingering perceptions by refreshing water ice consumption
Posted: 10 September 2009 | D. Labbe & N. Martin, Department of Food Consumer Interaction, Nestlé Research Centre | No comments yet
Refreshing in foods and drinks is a perception strongly related to mouth state after product consumption. Oral dryness and roughness are lingering perceptions negatively related to refreshing perception whereas mouth wetting perception is a positive driver of refreshing perception. Since saliva seems to be related to mouth wetting, we explored if salivary flow and saliva lubricating properties could be potential markers of refreshing perception. To reach our objective, we explored on saliva flow and saliva lubricating properties the impact of a water ice consumption optimised to be perceived more refreshing than a standard water ice. As key results, the optimised water ice induced the highest saliva flow rate and saliva production with the lowest friction coefficient. These results were validated by sensory evaluation, showing that the optimised product delivered after consumption the most intense salivating perception. Our finding seems to validate the positive association between refreshing and oral wetting perceptions.
Refreshing in foods and drinks is a perception strongly related to mouth state after product consumption. Oral dryness and roughness are lingering perceptions negatively related to refreshing perception whereas mouth wetting perception is a positive driver of refreshing perception. Since saliva seems to be related to mouth wetting, we explored if salivary flow and saliva lubricating properties could be potential markers of refreshing perception. To reach our objective, we explored on saliva flow and saliva lubricating properties the impact of a water ice consumption optimised to be perceived more refreshing than a standard water ice. As key results, the optimised water ice induced the highest saliva flow rate and saliva production with the lowest friction coefficient. These results were validated by sensory evaluation, showing that the optimised product delivered after consumption the most intense salivating perception. Our finding seems to validate the positive association between refreshing and oral wetting perceptions.
Refreshing in foods and drinks is a perception strongly related to mouth state after product consumption. Oral dryness and roughness are lingering perceptions negatively related to refreshing perception whereas mouth wetting perception is a positive driver of refreshing perception. Since saliva seems to be related to mouth wetting, we explored if salivary flow and saliva lubricating properties could be potential markers of refreshing perception. To reach our objective, we explored on saliva flow and saliva lubricating properties the impact of a water ice consumption optimised to be perceived more refreshing than a standard water ice. As key results, the optimised water ice induced the highest saliva flow rate and saliva production with the lowest friction coefficient. These results were validated by sensory evaluation, showing that the optimised product delivered after consumption the most intense salivating perception. Our finding seems to validate the positive association between refreshing and oral wetting perceptions.
Refreshing perception is a complex perception induced by a combination of several key sensory stimuli such as high coldness, high sourness, low thickness and low sweetness1,2. Refreshing perception may also be associated to the alleviation of oral dryness and consequently to oral wetting perception3. This assumption was corroborated by perceptual findings showing that refreshing was negatively correlated to astringency1,4, astringency being related to oral dryness and roughness5. The two objectives of the present study were to compare the impact of two water ices varying in refreshing intensity, thanks to the addition of a cooling substance and citric acid, on oral wetting in terms of saliva flow rate and saliva lubricating effect, and lingering sensory perceptions. We hypothesised that the most refreshing product should induce the highest saliva flow rate and a production of saliva with the highest lubricating properties and that physiological results could be validated by perceptual evidence. A glass of cold water (+8°C) was used as reference for the physiological experiment since cold water was reported as enhancing the saliva flow rate6-8.
First experiment: physiological measurement
Material and methods: products
Two flavoured citrus water ices were used (called standard water ice and optimised water ice). They mainly contained water (70 grams) and sucrose (25 grams). The difference in refreshing intensity between both products was obtained by added in the optimised water ice 0.04 per cent of cooling agent L-127039 provided by Givaudan (Dübendorf, Switzerland) and 0.20 per cent of citric acid, as coldness and sourness are drivers of refreshing perception1. Preliminary studies validated that, compared to the standard water ice, the optimised water ice was significantly perceived as being more intense in sourness and coldness according to sensory profiling results; and more refreshing according to consumers test results. Water ices were served at -17°C. The water was a glass of 70 millilitres of Vittel served at 8°C.
Subjects
Saliva was collected from six male volunteers between the age of 18 and 35, selected among employees at Nestlé Research Centre (Lausanne, Switzerland). They were healthy as determined by a medical questionnaire and had a BMI in the range of 18-30. All participants gave their written consent and were paid for their participation. The study was conducted in accordance with the Helsinki Declaration and was approved by the Ethical Committee for Clinical Research of Medicine and Biology Faculty (Lausanne University, Switzerland). Subjects were required not to consume any food or drink after standardised breakfast from 07:50 to 12:00 in order to ensure comparable conditions among subjects.
Saliva collection and product administration
Subjects arrived at 12:00 at the metabolic unity. First, saliva was immediately collected before product consumption during five minutes (PRE). Subjects were sitting and at rest, i.e. they did not stimulate the salivation but waited until they had too much saliva in their mouth to spit out in a beaker. Then, one of the three products was administrated. The complete consumption of a water ice lasted five minutes. One product was evaluated per day; the study was therefore completed in three days. Product order was randomised between sessions and subjects according to a Latin Square experimental design. During the 60 seconds following product consumption, they were asked to swallow normally in order to eliminate in-mouth product residues and finally saliva was collected during five minutes.
Assessment of saliva lubricating effect by measurement of friction coefficient between tongue and palate using tribometry
Saliva lubricating properties directly affects in-mouth friction between tongue and palate. Indeed the higher the saliva lubricating effect, the lower the friction coefficient. In vivo measurement of friction coefficient between tongue and palate is technically challenging, this is why friction coefficient measurements were conducted using a tribometer. The device was developed to reproduce the friction movement between the tongue and the palate (Figure 1)9,10. The tribometer enforces a reciprocating sliding motion between a PCTFE (polychlorotrifluoroethylene) hemisphere which stands for the palate and a rough silicone rubber which represents the tongue. Contact is ensured through application of a normal force. The tangential force is measured, and from this, the friction coefficient is determined automatically.
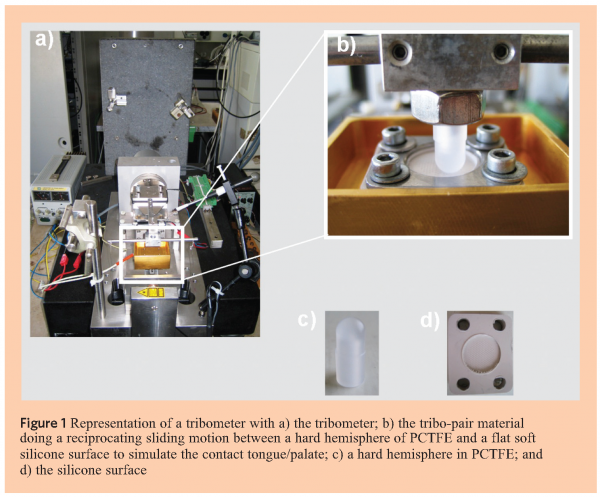

During the test, the temperature was maintained at 37°C with a temperature-controlled vessel to which the silicone surface can be fixed. The pin in PCTFE is first screwed at the end of the loading arm and comes into contact with the silicone surface with a contact load not exceeding 0.04 newton. Then, a load of 0.5 newton was applied thanks to dead weights that were suspended to the tribometer arm to obtain a Hertzian pressure of 310 kPa that approximately corresponds to the pressure recorded in vivo with pressure transducers. To reproduce the velocity of tongue movements, a triangular waveform with a frequency of one hertz (that corresponds to a velocity o/f 10 mms-1) was applied. The displacement of the pin in PCTFE is measured thanks to the relative motion of a laser placed on the arm and recorded by a photodetector (Hamamatsu, France). The systems allows measuring the tangential force magnitude (Ft) corresponding to the friction force, the normal force and the temperature. Thus, the friction coefficient (μ) is obtained by dividing the friction force by the applied normal force (Fn) magnitude according the following equation:
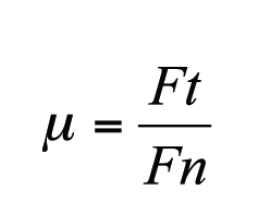

μ: Coefficient of friction
Ft: Friction force (N)
Fn: Normal force (N)
The friction coefficient is first measured under dry conditions until the plateau region is reached. Then, the motion is stopped and the loading arm is lifted up with a wedge to add 0.5 mL of saliva with a micropipette. The pin in PCTFE comes again into contact with the silicone surface and the motion is started again after stabilising the temperature.
To calculate the average friction coefficient during dry and lubricated contact, at least 100 data points of the plateau region of the friction coefficient-versus-time curve are taken into account. All tests are done in duplicate.
Statistical analysis
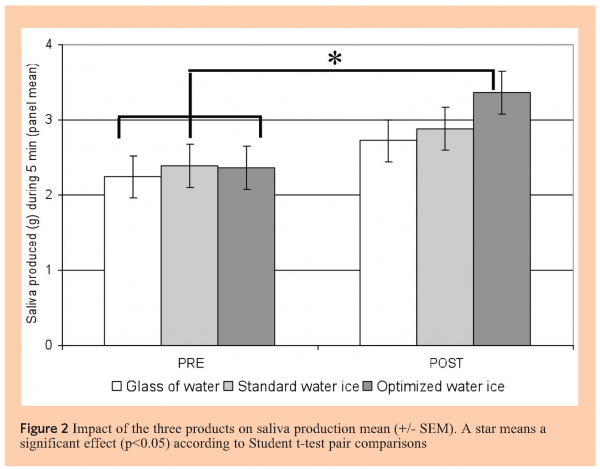
The amount of produced saliva collected during five minutes was expressed in g. Product impact on saliva production collected after product consumption (POST) was measured according to a product (optimised water ice, standard water ice, glass of water) x subject covariance analysis with interactions. Saliva production measurement before product consumption (PRE) was considered as baseline and used as a covariate variable.
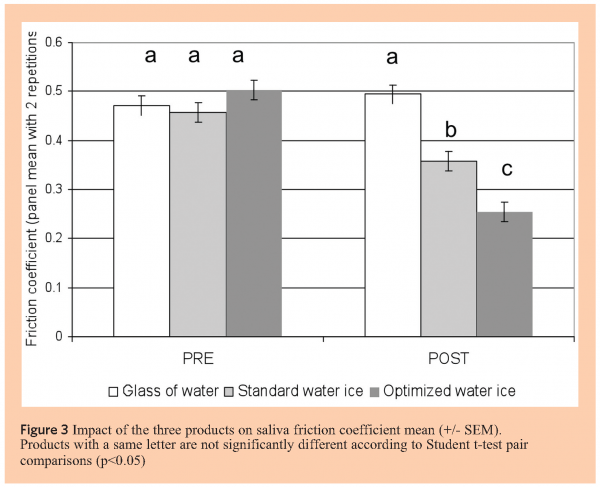
Product impact on friction coefficient in POST was measured according to a product (optimised water ice, standard water ice, glass of water) x repetition x subjects covariance analysis with interactions. Friction coefficient measurement in PRE was considered as baseline and used as a covariate variable.
Analyses of Variance (ANOVA) were calculated, using NCSS software version 2007 (Number Cruncher Statistical Systems, Karysville, Utah, USA.). Post-hoc pair comparisons were conducted by a two-tailed Student t-test. Confidence level was set to 95 per cent for all analyses
Results
There was no significant impact of products on the salivary production after consumption [F(2,26)=0.73, P=0.49] (Figure 2). However, comparing saliva product before and after consumption of the products, Student paired T-test showed a significant increase of the saliva production after consumption of the optimised water ice (p<0.05).

There was a significant impact of products on friction coefficient [(F(2,61)=15.6, p<0.01). Saliva produced after consumption of the glass of water led to the highest friction coefficient, whereas saliva produced after consumption of the optimised water ice had the lowest friction coefficient (Figure 3). According to Student t-test (two-tailed, paired), friction coefficient remained constant before and after consumption of the glass of water, whereas it decreased after consumption of both water ices (p-value<0.05 per cent).

Second experiment: Sensory evaluation
Material and methods: products
Only the two flavoured citrus water ices of Experiment 1 were used. The glass of water was not kept since water and water ice are not comparable by descriptive sensory evaluation methods because of the wide difference in terms of sensory characteristics.
Subjects and attributes
An external panel of 41 subjects experienced in sensory evaluation was recruited. They did not follow specific trainings for this study since they knew the sensory method and the five attributes used in this study: flavour intensity, sweetness, bitterness, coldness and salivating. The list of attributes was set up after a 90 minute session where a list of terms were generated and then reduced according to the ISO 1103511. All the attributes were presented simultaneously on the computer screen with their corresponding 10 centimetre unstructured linear scale, anchored at the extremities with ‘not at all intense’ and ‘very intense.’
Method principle
TDS is an adapted Time-Intensity method which allows consideration of the multidimensionality of the perceptual space over time12,13. This descriptive sensory method consists in assessing iteratively at each specific time until the perceptions end which perception is dominant and in scoring its intensity. In this study, the meaning of dominant was the most intense sensation. The evaluation was conducted four minutes into eating and then continued six minutes after eating.
Once the subject started to bite the product the product, he clicked on a start button on the screen to begin the evaluation. During an evaluation, the subject had to select the attribute considered as dominant and score this attribute on a linear scale. When the dominant perception changed, the subject had to score the new dominant sensation. The subject was free to choose the same attribute several times or conversely to never select an attribute as dominant.
Tasting conditions
Data acquisition was carried out on a computer with FIZZ software Version 2.20E (Biosystemes, Couternon, France). Products were evaluated by all subjects during one session and presented according to a design balancing position and order effects, based on Williams Latin Squares. Products were coded with three-digit random numbers and the 70 millilitre portion was served at -17°C on a plastic plate. Rinsing was done between products with water and unsalted crackers during a five minute break. Tests were conducted in an air-conditioned room (22°C), under white light in individual booths. The products were consumed according to a standardised procedure, i.e. subjects were asked to bite the product every five seconds and to swallow normally during the evaluation. According to this procedure, duration required for complete product consumption was approximately four minutes.
Statistical analyses
TDS data were represented by curves showing the percentage of subjects who selected the attribute as dominant at a specific time for each product, i.e. the dominance rate. The frequency of selection of each attribute as dominant by all subjects is represented as a percentage (Axis Y) every 1.5 seconds, which corresponds to the data collection interval, during the five minute period (Axis X). The 200 points of the evolution curve were smoothed using a non-weighted moving average with a 10 points window. The curve showed over time the dominant attributes at a panel level. For each 1.5 second step, the proportion of scoring for an attribute was considered as significantly dominant when above Ps (the smallest dominance rate to reach to be significantly above the chance limit) as defined according to the equation (2), and as dominant when between P0 (dominance rate obtained if all subjects scored by chance) and Ps, in this case we considered results as a trend.
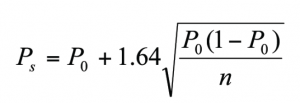

With chance level P0 = 1/(k+1), k being the number of attributes, n the number of subjects and 1.64 the one-tailed normal law z value for α= five per cent.
Results
TDS curves showed that after consumption of the standard water ice, no clear dominant sensation could be highlighted (Figure 4a) since salivating and coldness curves were above the significant level only during a short time period. Regarding results obtained after optimised water ice consumption (Figure 4b), lingering perception was clearly dominating in terms of salivating perception since the salivating attribute curve was above the significant level during 100 seconds and then slowly decreased to reach the chance level 500 seconds after the end of consumption. In addition, for salivating attribution, panel agreement was higher for the optimised water ice than for standard water ice with a maximal dominance rate of 40 per cent and 33 per cent, respectively.
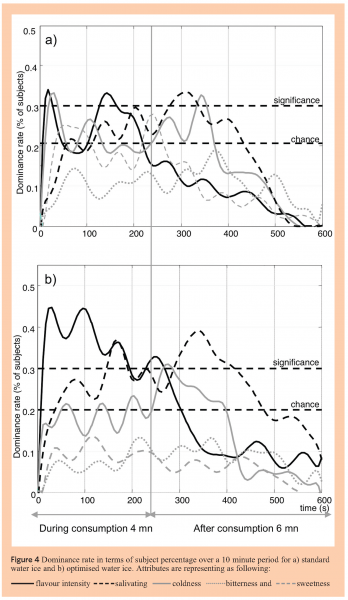

Interestingly, during consumption, the flavour intensity was significantly different between products. Flavour intensity of the optimised water ice was perceived dominant during all four minutes consumption with a maximum dominant rate of 45 per cent, whereas flavour intensity delivered by the standard water ice was dominant during very short periods and with a lower panel agreement since the maximal dominance was 33 per cent.
Discussion
After consumption of the optimised product, the saliva flow rate was significantly enhanced. The mouth wetting ability of the product was shown as a physiologically property of products perceived as refreshing and thirst quenching3,14. This effect was probably due to the addition of citric acid that elicited salivatory reflex15. Cooling agent might also enhance saliva production since a previous study showed that cold water at 0°C and 3°C causes more salivation than water at 22°C or 33°C6,7. In addition, a study showed that a mouth rinse with menthol, a cooling agent, increases the coldness of water perceived in mouth16. Cooling agent might have potentiated the enhancing impact of citric acid on saliva flow.
Comparing both water ices, the optimised water ice consumption led to saliva production with the highest lubricating properties in terms of friction coefficient. A saliva production with a high lubricating effect probably reduces perception of oral roughness, dryness or astringency that are negative drivers of refreshment1,3,4. This latter finding could physiologically explain the higher refreshing perception caused by the optimised water ice compared to the standard water ice.
At a perceptual level, the optimised water ice was significantly perceived as more salivating than the standard water ice in terms of dominance and duration of perception.
Additional works could extend our understanding of physiological mechanisms underlying the enhancement of saliva flow rate and saliva lubricating properties by a citric acid and cooling agent mixture.
References
- Labbe, D.; Gilbert, F.; Antille, N.; Martin, N. Sensory determinants of refreshing. Food Qual Prefer 2009;20:100-109
- Labbe, D.; Almiron-Roig, E.; Hudry, J.; Leathwood, P.; Schifferstein, H. N. J.; Martin, N. Sensory basis of refreshing perception: role of psychophysiological factors and food experience. Physiol Behav (accepted for publication)
- Brunstrom, J. M. Effects of mouth dryness on drinking behavior and beverage acceptability. Physiol Behav 2002; 76:423-429
- Guinard, J. X.; Souchard, A.; Picot, M.; Rogeaux, M.; Sieffermann, J. M. Sensory determinants of the thirst-quenching character of beer. Appetite 1998;3:101-115
- Lesschaeve, I.; Noble, A. C. Polyphenols: factors influencing their sensory properties and their effects on food and beverage preferences. Am J Clin Nutr 2005; 81:330S-335S
- Pangborn, R. M.; Chrisp, R. B.; Bertolero, I. I. Gustatory, salivary, and oral thermal responses to solutions of sodium chloride at four temperatures. Percept Psychophys 1970;8:69-75
- Brunstrom, J. M.; MacRae, A. W.; Roberts, B. Mouth-state dependent changes in the judged pleasantness of water at different temperatures. Physiol Behav 1997; 61:667-669
- Lee, A.; Guest, S.; Essick, G. Thermally evoked parotid salivation. Physiol Behav 2006;87:757-764
- Ranc, H.; Elkhyat, A.; Servais, P. F.; Mac-Mary, S.; Launay, B.; Hummel, T. Friction coefficient and wettability of oral mucosal tissue : changes induced by a salivary layer. Colloid Surface A 2005;276:155-161
- Ranc, H.; Servais, P. F.; Chauvy, S.; Debaud, S.; Mischler, S. Effect of surface structure on frictional behaviour of a tongue/palate tribological system. Tribol Int 2006; 39:1518-1526
- ISO 11035. Analyse sensorielle, Recherche et sélection de descripteurs pour l’élaboration d’un profil sensoriel, par approche multidimensionnelle. In: Recueil de normes françaises Contrôle de la qualité des produits alimentaires-Analyse sensorielle. AFNOR ed. Paris; 1995:p271-300
- Labbe, D.; Schlich, P.; Pineau, N.; Gilbert, F.; Martin, N. Temporal Dominance of Sensations and Sensory Profiling: A Comparative Study. Food Qual Prefer 2009;20:216-221
- Pineau, N.; Schlich, P.; Cordelle, S.; Mathonnière, C.; Issanchou, S.; Imbert, A.; Rogeaux, M.; Etiévant, P.; Koster, E. P. Temporal Dominance of Sensations: Construction of the TDS curves and comparison with time-intensity. doi:10.1016/j.foodqual.2009.04.005
- Figaro, M. K.; Mack, G. W. Regulation of fluid intake in dehydrated humans: role of oropharyngeal stimulation. Am J Physiol 1997;272:R1740-R1746
- French, S. J.; Read, N. W.; Booth, D. A.; Arkley, S. Satisfaction of hunger and thirst by foods and drinks. Brit Food J 1995;95:19-26
- Green, B. G. Menthol modulates oral sensations of warmth and cold. Physiol Behav 1985;35:427-434


