Predictive modelling of microbial behaviour in foods: an industrial perspective and applications
- Like
- Digg
- Del
- Tumblr
- VKontakte
- Buffer
- Love This
- Odnoklassniki
- Meneame
- Blogger
- Amazon
- Yahoo Mail
- Gmail
- AOL
- Newsvine
- HackerNews
- Evernote
- MySpace
- Mail.ru
- Viadeo
- Line
- Comments
- Yummly
- SMS
- Viber
- Telegram
- Subscribe
- Skype
- Facebook Messenger
- Kakao
- LiveJournal
- Yammer
- Edgar
- Fintel
- Mix
- Instapaper
- Copy Link
Posted: 5 November 2010 | François Bourdichon & Mohamed Hedi Ben Cheikh, Food Safety Centre, Danone Corporate | No comments yet
Mathematics is everywhere. One might go into the field of biology to avoid numbers and equations, yet they are still there, helping food technologists to decipher the behaviour of micro-organisms in different food matrices and along the process chain. Since the negation of the spontaneous generation theory by Louis Pasteur in the 19th Century, the different phases of bacterial growth have been well defined: lag phase, exponential phase, stationary phase. Yet this simplistic approach of molecular mechanism isn’t that easy to model through polynomial equation, when taking into consideration the food matrix and role of preservative factors.
Mathematics is everywhere. One might go into the field of biology to avoid numbers and equations, yet they are still there, helping food technologists to decipher the behaviour of micro-organisms in different food matrices and along the process chain. Since the negation of the spontaneous generation theory by Louis Pasteur in the 19th Century, the different phases of bacterial growth have been well defined: lag phase, exponential phase, stationary phase. Yet this simplistic approach of molecular mechanism isn’t that easy to model through polynomial equation, when taking into consideration the food matrix and role of preservative factors.
Mathematics is everywhere. One might go into the field of biology to avoid numbers and equations, yet they are still there, helping food technologists to decipher the behaviour of micro-organisms in different food matrices and along the process chain. Since the negation of the spontaneous generation theory by Louis Pasteur in the 19th Century, the different phases of bacterial growth have been well defined: lag phase, exponential phase, stationary phase. Yet this simplistic approach of molecular mechanism isn’t that easy to model through polynomial equation, when taking into consideration the food matrix and role of preservative factors.
The first attempt to model microbial behaviour in foods was the preliminary experience almost a century ago to quantify the heat reduction in food matrices5,6,8,18. The concept of a sterilising value (F-value) was developed10 and is usually expressed in minutes at 121.1°C (250°F) to destroy an organism. Since then, biologists and mathematicians together have worked to define different models to explain the growth of bacteria, with growing complexity in the equations and concepts used2,17,16,20,1.
Interest for predictive modelling of microbial behaviour in foods arose in the late 1980’s with the first reported major foodborne outbreaks, and the emergence of Listeria monocytogenes as a major pathogen, 60 years after its first isolation12. The need for quantitative microbiology to conduct the risk assessment of one microbial hazard pushed scientists into this newly emerging domain. Predictive modelling became an important tool to conduct quantitative microbial risk assessment, yet necessary but not sufficient, and with different endpoints nowadays14. We will focus in this article on the use of predictive models for assessing bacterial growth.
Segmentation of microbial growth
As shown in Figure 1, microbial growth can easily be separated in different phases, each with a biological signification. Since predictive models are under construction for death phase / survival of microorganisms, we will limit ourselves to latence, growth and stationary phases.
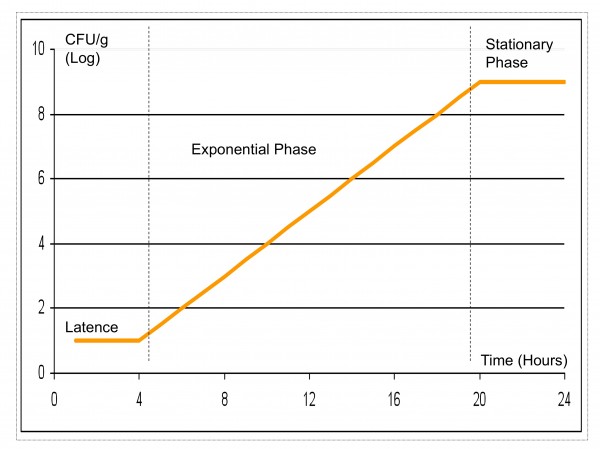

Figure 1 Microbial growth – different phases
Lag Phase
Lag Phase or Latence or Latent-phase, expressed as (lag), can be defined as the amount of time required for a cell to adjust to a new environment prior to replication (growth). Lag Phase is the most unpredictable part of a growth curve, and it is thought that it depends mostly on the history of the microorganism13,7,9,11.
Growth Phase or Exponential Phase
The Growth Phase represents the replication (multiplication) of microorganisms and is described in terms of growth rate, the change in bacterial numbers over a period of time, typically expressed as log10 per hour or day as (mu).
Stationary Phase and Maximum Population
The terms Stationary Phase and Maximum Population refer to the maximum (highest) level that bacteria reach in the food (Nmax). This level can be affected by the presence of other bacteria, commensal flora or starters and limiting nutrients, and is specific to each matrix.
Modelling microbial behaviour
Different mathematical models are proposed in scientific literature, depending mostly on empirical adjustment of one equation rather than going through a mechanistic definition of growth.
Basically, a so called ‘primary’ model is based on the behaviour of populations of micro-organisms exposed to a specific defined environmental condition solely as a function of time3,4. Primary models are used to describe growth kinetics in foods or inactivation (see Figure 2).
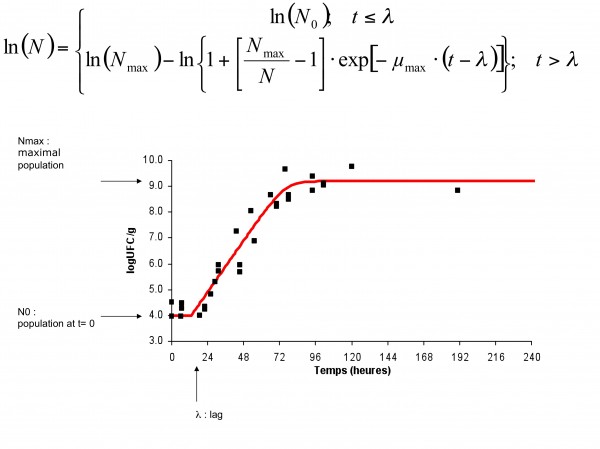

Figure 2 Primary model: time dependant microbial growth
Secondary models ‘extract’ data from primary models to describe the influence of a specific environmental condition (e.g. increasing temperature, acidification or desiccation) on the growth. Different secondary models are proposed (Square Root Model, Polynomial, Cardinal) – in this article we will focus on the cardinal model and the gamma model17,19 (see Figure 3). Best described factors affecting growth are pH, mostly with HCl various concentration, water activity – aw – with NaCl and temperature. But we are not yet able to clearly understand all the factors of the food matrix that might have a role in the growth at the individual cell scale. A tertiary model is the next step of model development, when secondary model predictions are used in a primary growth model (e.g. modelling growth with different temperatures). Tertiary models are currently used within current predictive tools (see Box 1).
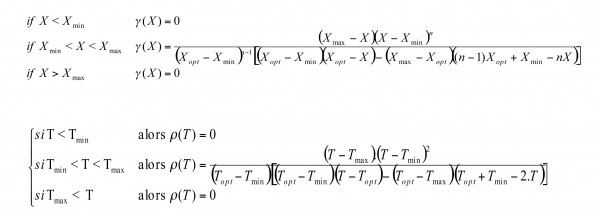

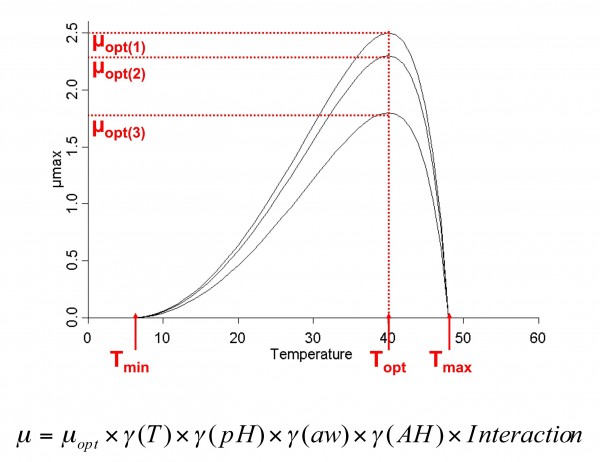

Figure 3 Secondary model: evolution of growth factor μ depending on the variation of one environmental condition
Using a predictive model for assessing bacterial growth
Lots of predictive tools are available on the internet directly, or in collaboration with numerous food technology institutes. Does that necessarily mean one can have full confidence in the results of the predictive model? Or begin from scratch to assess the growth of microorganisms in its food product? Certainly not!
From the Gamma concept (we will discuss next interaction model), one can use cardinal values (e.g. Tmax, pHmin – specific to one microorganism) to assess the growth of a bacterium. and Nmax are generally specific to the couple microorganism/food matrix. Most of the published values have been estimated in liquid broth for various microbial species, but less data is available in model food matrices, with a limited number of species (Listeria monocytogenes, Bacillus cereus, Salmonella spp.). What is meaningful for pork pate isn’t for raw cow milk cheese.
The algorithm for using a food model can be a very simplistic approach. One challenge test is to estimate Nmax and , and therefore from the gamma concept opt – equivalent to optimal growth rate when all interactions of the food matrix do not influence growth (see Figure 3). A second challenge test is conducted to adjust the model and validate it. From this, it becomes possible to run numerous model simulations and see when growth might occur, and which level of population is reached.
A recent growing use of predictive modelling for food manufacturers is specifically to define the growth / no growth conditions of pathogenic microorganisms and spoilage flora, and therefore establish conservative criteria (e.g. physico-chemistry parameters, temperature conservation).
Limits of predictive modelling
Mathematical modelling will always give an answer. The relevance of it will always (at least for now) need the eye of the microbiologist to be confirmed. Since these models were proposed from an empirical and rather deterministic approach, the model is more empirical than mechanistic, and fails to take all factors in consideration. The results are generally fail-safe. This main default has been corrected in the last few years, and a probabilistic approach is now proposed to integrate variability of microbial behaviour and uncertainty due to different physiological conditions. More and more factors are also now taken into consideration (organic acids instead of HCl for pH, sugars instead of NaCl for aw, interaction with microflora) leading to better accuracy of the prediction15.
All is not modelled yet. Lag phase duration modelling is still under discussion, as well as germination for sporulated bacteria, survival to desiccation or other stress reduction other than heating, concept of microenvironnement and nutrient availability and single cell growth.
Applications of predictive modelling of microbial behaviour in foods
By trying to answer all the questions raised by food microbiologists (if it ever will), predictive tools have become very important since the European regulation 2073/2005 on microbiological criteria for foodstuffs. Guidelines are now available for defining the growth / no growth boundaries of food spoilers and pathogens in food products.
Predicting modelling is also very helpful for defining the shelf life duration of one food product; guidelines have been published by the French food safety agency for the shelf life validation of L. monocytogenes e.g. behaviour of the microorganism is interesting to assess, but is not the sole point of control of the safety of one product. Conservation temperature abuse is one of the major contributing factors to foodborne outbreaks. Microbial temperature time integrators have been recently developed, and validated through predictive modelling. Other examples are given in Figure 4, from Mc Meekin et al.
Predictive microbiology in Danone
Danone Food Safety Centre takes an active stance in developing predictive modelling, with participation in the French scientific project Sym’Previus, an internally developed application in the last 15 years, firstly with the Dynacard software with Laurent Rosso, then the Gamma Concept from Marcel Zwietering to today’s HACCP quantitative approach of the food process and validation of shelf life of existing and underdevelopment food products.
A quantitative approach (see Figure 5) helps define critical points (pasteurisation step for the proposed example of the hazard L. monocytogenes) to rationalise a priori the HACCP plan.
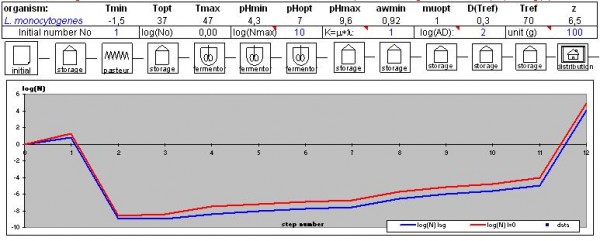

Figure 5 Application of Deterministic Predictive Modelling to HACCP of one food process DANONE Internal Assessment
Another recent use is the estimation of shelf life of the technological flora, with the internal development of a cardinal values database.
Minimal inhibitory concentrations of organic acids are also needed, particularly in our case of fermented food products.
See New Food Issue 4, 2007 for another insight on use of predictive microbiology from Jeanne Marie Membré (Unilever).
References
1. Augustin, J. C. and V. Carlier. 2000. Mathematical modelling of the growth rate and lag time for Listeria monocytogenes. Int J Food Microbiol 56:29-51
2. Baranyi, J., P. J. McClure, J. P. Sutherland, and T. A. Roberts. 1993. Modeling bacterial growth responses. J-ind-microbiol 12:190-194
3. Baranyi, J. and T. A. Roberts. 1994. A dynamic approach to predicting bacterial growth in food. Int J Food Microbiol 23:277-294
4. Baranyi, J. and T. A. Roberts. 1995. Mathematics of predictive food microbiology. Int J Food Microbiol 26:199-218
5. Bigelow, W. D. 1921. Logarithmic Nature of Thermal-death-time Curves. Journal of Infectious Disease 29:528-536
6. Buchanan, R. E. 1918. Life Phases in a bacterial culture. Journal of Infectious Disease 23:109-125
7. Buchanan, R. L. and L. A. Klawitter. 1991. Effect of temperature history on the growth of Listeria monocytogenes Scott A at refrigeration temperatures. Int. J. Food Microbiol. 12:235-245
8. Chick, H. 1908. An Investigation of the Laws of Disinfection. J. Hyg. (Lond) 8:92-158.
9. Dufrenne, J., E. Delfgou, W. Ritmeester, and S. Notermans. 1997. The effect of previous growth conditions on the lag phase time of some foodborne pathogenic micro-organisms. Int. J. Food Microbiol. 34:89-94
10. Esty, J. R. and R. F. Meyer. 1922. The heat Resistance of the spores of B. Botulinus and allied anaerobes. Journal of Infectious Disease 31:650
11. HUDSON, J. A. 1993. Effect of pre-incubation temperature on the lag time of Aeromonas hydrophila. Lett-appl-microbiol 16:274-276
12. ILSI. 2005. Achieving continuous improvement in reductions in foodborne listeriosis–a risk-based approach. J. Food Prot. 68:1932-1994
13. McKellar, R. C. and K. Knight. 2000. A combined discrete-continuous model describing the lag phase of Listeria monocytogenes. Int J Food Microbiol 54:171-180
14. McMeekin, T. A., J. Brown, K. Krist, D. Miles, K. Neumeyer, D. S. Nichols, J. Olley, K. Presser, D. A. Ratkowsky, T. Ross, M. Salter, and S. Soontranon. 1997. Quantitative microbiology: a basis for food safety. Emerg. Infect. Dis. 3:541-549
15. Mejlholm, O., A. Gunvig, C. Borggaard, J. Blom-Hanssen, L. Mellefont, T. Ross, F. Leroi, T. Else, D. Visser, and P. Dalgaard. 2010. Predicting growth rates and growth boundary of Listeria monocytogenes – An international validation study with focus on processed and ready-to-eat meat and seafood. Int. J. Food Microbiol. 141 :137-150
16. Ratkowsky, D. A., R. K. Lowry, T. A. McMeekin, A. N. Stokes, and R. E. Chandler. 1983. Model for bacterial culture growth rate throughout the entire biokinetic temperature range. J Bacteriol. 154:1222-1226
17. Rosso, L., J. R. LOBRY, S. BAJARD, and J. P. Flandrois. 1995. Convenient model to describe the combined effects of temperature and p H on microbial growth. Appl-environ-microbiol-Print 61:610-616
18. Slator, A. 1917. A Note on the Lag-phase in the Growth of Microorganisms. J. Hyg. (Lond) 16:100-108
19. Wijtzes, T., P. J. McClure, M. H. Zwietering, and T. A. Roberts. 1993. Modelling bacterial growth of Listeria monocytogenes as a function of water activity, pH and temperature. Int-j-food-microbiol 18:139-149
20. Zwietering, M. H., K. O. O. S. DE, B. E. HASENACK, W. I. T. DE, and T. VAN. 1991. Modeling of bacterial growth as a function of emperature. Appl-environ-microbiol-Print 57:1094-1101
About the Authors
François Bourdichon & Mohamed Hedi Ben Cheikh
François and Hedi work in Danone Food Safety Centre within the Daniel Carasso research and development centre in France. They are in charge of the predictive modelling program and different applications. François represents Danone in external committees and organisations like SYM’Previus, ILSI Europe and IDF. Hedi develops internal tools and models with predictive modelling to quantify the assessment of microbial risks for DANONE Products and Processes.


