Monitoring the shelf life of minced beef meat using NIR and MIR spectroscopy
Posted: 3 March 2011 | Nicoletta Sinelli and Ernestina Casiraghi, DiSTAM, Department of Food Science and Technology, Università degli Studi di Milano | No comments yet
The meat processing industry has shown an increasing demand for fast and reliable methods to determine product quality characteristics during the last few decades. Traditional quality analyses based on chemistry and microbiology have several drawbacks, the most significant of which are low speed, use of chemical products, high manual dexterity, destruction of the sample and the physical distance between the process and the analytical instrument. Several fast and non destructive instrumental methods have been proposed. Infrared spectroscopy has proven to be an interesting and good analytical method for at-line, on-line and in-line analyses for a variety of meat products and quality parameters.
The meat processing industry has shown an increasing demand for fast and reliable methods to determine product quality characteristics during the last few decades. Traditional quality analyses based on chemistry and microbiology have several drawbacks, the most significant of which are low speed, use of chemical products, high manual dexterity, destruction of the sample and the physical distance between the process and the analytical instrument. Several fast and non destructive instrumental methods have been proposed. Infrared spectroscopy has proven to be an interesting and good analytical method for at-line, on-line and in-line analyses for a variety of meat products and quality parameters.
The meat processing industry has shown an increasing demand for fast and reliable methods to determine product quality characteristics during the last few decades. Traditional quality analyses based on chemistry and microbiology have several drawbacks, the most significant of which are low speed, use of chemical products, high manual dexterity, destruction of the sample and the physical distance between the process and the analytical instrument. Several fast and non destructive instrumental methods have been proposed. Infrared spectroscopy has proven to be an interesting and good analytical method for at-line, on-line and in-line analyses for a variety of meat products and quality parameters. In particular, in the NIR region (between 750 and 2500 nanometres), vibration and combination overtones of the fundamental O-H, C-H and N-H bounds are the main recordable phenomena1. Mid-infrared (FT-IR) spectroscopy (4000–400cm−1), applied to a food sample, is based on the measurement of the fundamental frequencies of chemical bonds in functional groups such as C-C, C-H, O-H, C=O and N-H2. In recent years, a very large number of near and mid application on meat products have been reported. It is well known that NIR spectroscopy can be applied for the measurement of fat, moisture and protein simultaneously3. Moreover, NIR spectroscopy has successfully been applied to determine minor components, such as fatty acids, sensory attributes and to predict previous heat treatments, freeze determination and meat speciation4. Even if literature data report several studies relating to the use of NIR and MIR spectroscopy as a rapid and cost-effective analytical tool to predict simultaneously numerous meat quality parameters, no work has been made on the use of these techniques to evaluate the shelf life of beef. As meat freshness is highly reported by consumers, the aim of this work was to investigate the freshness decay of this product stored at different temperatures by applying NIR and MIR spectroscopy. In particular, the scope was to determine whether meat samples were similar or dissimilar and could be separated in homogenous groups due to the storage conditions and to determine which wavenumbers were linked to the molecular modifications the samples underwent during storage.
Materials and methods
Minced beef meat PS trays (600 grams), packaged in modified atmosphere (70 per cent oxygen and 30 per cent carbon dioxide) were supplied by the manufacturer at the beginning of their commercial life and were stored at three different controlled temperatures (4.3, 8.1 and 15.5°C). The average storage temperatures were measured by time–temperature recording devices (TB Econorma SAS, Treviso, Italy). The resulted temperature averages were 4.3, 8.1 and 15.5°C, with a standard deviation of less than 0.2°C. At each sampling time for each temperature, three samples were analysed. Twenty-seven samples stored at 4.3°C were analysed after 1.0, 1.9, 2.8, 6.2, 7.0, 8.0, 9.0, 10.0, and 11.0 days; twenty-one samples stored at 8.1°C after 0.8, 1.8, 2.8, 3.8, 6.2, 7.2, and 8.2 days and fifteen samples stored at 15.5°C after 0.9, 1.1, 1.9, 2.9, 3.9 days. At higher temperatures, fewer samples were analysed as the decay of meat was faster. At each time (depending on temperature), FT-NIR spectra were collected by using a FT-NIR spectrometer (MPA, Bruker Optics, Ettlingen, Germany, Figure 1. The samples (about 125 grams) were scanned in glass Petri dishes (diameter nine centimetres) and analysed in reflectance mode using an integrative sphere. The spectrum of each sample was collected in the range 12500-3600cm−1 at room temperature (25+1°C) with a resolution of 32 cm−1 (scanner velocity: 10 kHz; background: 150 scans, sample: 150 scans). The spectral acquisition and instrument control was performed by OPUS software (v. 6.5 Bruker Optics, Ettlingen, Germany). At each storage time, three samples were analysed and the average spectra were used for further statistical evaluations.
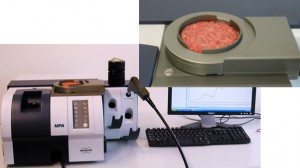

Figure 1 FT-NIR spectrometer
FT-IR measurements were taken using a spectrometer (VERTEX 70, Bruker Optics, Ettlingen, Germany, Figure 2) provided with a horizontal germanium crystals attenuated total reflectance (ATR) plate (Pike Technologies, Inc., Madison, USA). Fifteen grams of minced beef were pressed on the ATR plate in order to cover the crystal. The spectra were recorded in the range 4000–700cm−1 at room temperature (25 + 1°C) with a resolution of 4 cm−1. OPUS software (v. 6.5, Bruker Optics, Ettlingen, Germany) was used for spectral acquisition, instrument control and preliminary file manipulation.
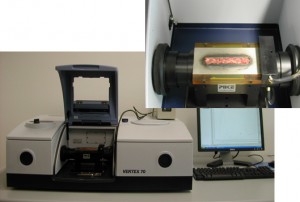

Figure 2 Bruker Optics VERTEX 70 spectrometer
Spectroscopic data were analysed using principal component analysis (PCA) (The Unscrambler, version 9.7, Camo, Inondhcim, Norway). In order to minimise the effect of baseline shifts, the spectral data were preprocessed by several mathematical treatments. The NIR spectral data were transformed into the second derivative (Savitzky–Golay method, gap size = 15 data points), while the MIR spectral data were standardised by Standard Normal Variate (SNV). All spectral data sets were mean-centred before performing PCA calculations. In order to better describe the spectral changes undergone during storage, the values of the PC scores obtained by PCA applied to all the samples stored at three different temperatures were modelled as a function of time, using a sigmoid function implemented in Table Curve software (v. 4.0, Jandel Scientific, San Rafael, CA, USA). The function is expressed as y=a+b/[1+exp(c-x)/d] (1) where a is the maximum shift (from initial to equilibrium value) of the considered index (PC1 scores), b is the transition centre, x is the storage time, and c and d are two constants. The use of this type of sigmoid function is justified by the nature (enzymatic or microbialinduced) of the transformation in progress. The time of maximum velocity of the process, corresponding to the minimum value of the first derivative, was calculated and was associated with the time of initial freshness decay.
Results and discussion
The Fourier Transform near infrared (FT-NIR) spectra of minced meat collected during storage are dominated by some peaks at 6900 and 5183 cm-1 which are related to the first OH overtone and OH combination band of water respectively. Absorbance at 10290, 8831 and 4335 cm−1 are due to the bands rising from the second OH overtone, the first C-H overtone and C-H combination band of lipids1. A preliminary examination of the spectra was performed by PCA applied to the second derivative of the spectra in the range 12000- 3700 cm-1. The score plot (Figure 3), evidences a satisfactory distribution of the samples according to the storage conditions. In particular, the first component (71 per cent of the total variance) was able to separate the samples between ‘fresh’ (on the right side of the plot) and ‘old’ (on the left side of the plot) and to identify a shelf life threshold, corresponding to six to seven days for samples stored at 4.3°C, two to three days for samples stored at 8.1°C and one day for samples stored at the highest temperature. The loading intensity on PC1 and PC2 (Figure 4) plotted against wavenumbers showed the water and lipid component absorption bands as principal wavenumbers explaining variation during the storage of minced beef meat.
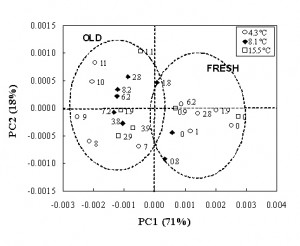

Figure 3 PCA applied to the second derivative of
The same multivariate approach was used to analyse the MIR spectra collected during storage. These spectra, in the range between 1800-930cm−1, are characterised by peaks attributed to carbonyl stretching of protein (amide I) in combination with the O-H deformation of water (1645 cm−1), N-H bend of protein (amide I) at 1550 cm−1 and the coupled C-O and C-C stretching vibrations at 1126 and 1078cm−1. Small features due to fat in meat are present at 1454 and 1402 cm−1 (C-H stretch of CH2 and CH3)5.
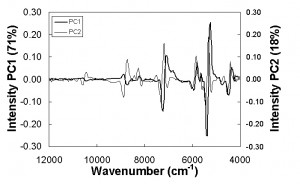

Figure 4 Loading intensity on PC1 and PC2 by
The PCA applied to the FT-IR spectra in the range 1800-930 cm−1 highlights the discriminating ability of the mid spectroscopy to separate the sample on the basis of the ‘freshness’ and to identify thresholds similar to those obtained in the near region. The score plot (Figure 5) shows that the samples stored at 4.3°C can be considered fresh (on the right side of the plot) up to about six days, those stored at 8.1 up to about three days, while up to one day for the samples stored at higher temperature. Taking into consideration the loading intensity on PC1 and PC2 (Figure 6), the main wavenumbers which explain the variation during the meat storage were 1643, 1550 and 1745 cm−1 related to carbonyl stretching of protein in combination with the O-H deformation of water, N-H bending of protein (amide I) and C=O stretching vibrations, respectively.
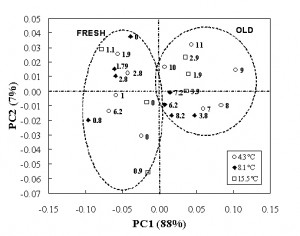

Figure 5 PCA applied to the FT-IR spectra between 1800 – 830cm-1
To better describe the spectral changes during storage at each temperature, the relevant PC1 scores, obtained by PCA applied to NIR and MIR spectral data, were plotted against time and modelled as a function of time, using the sigmoid function. In Figure 7, the modelling of PC1 scores of NIR spectral data is shown: the minimum of the first derivative of the sigmoid function, obtained interpolating PC1 scores at each temperature represents the time of maximum velocity of the process. This time was about seven days at 4.3°C, 2.2 days at 8.1°C and less than one day at 15.5°C and it corresponds to the start of the highest degradation rate, responsible for initial ‘freshness’ loss with a negative influence on the product quality. Storage beyond this point results in a product which rapidly will be no longer acceptable.
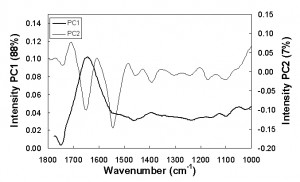

Figure 6 Loading intensity on PC1 and PC2 by wavenumbers (1800 – 830cm-1)
As for NIR spectroscopy, the PC1 sample scores obtained by MIR spectroscopy were plotted against time and the maximum velocity of the quality changes of minced beef was calculated in order to define the time of initial freshness decay, revealed by MIR spectroscopy. These times were 6.5 days at 4.3°C, 2.6 days at 8.1°C and less than one day at 15.5°C and they were in good accordance with those obtained by NIR spectroscopy.
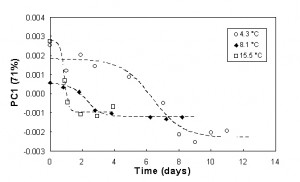

Figure 7Modelling of PC1 scores of NIR spectra data
On the basis of these results, freshness of minced beef packaged in modified atmosphere packaging is maintained for about six to seven days at 4.3°C (recommended storage temperature), two to three days at 8.1°C (usual temperature in household refrigerators) and less than one day at 15.5°C (abuse temperature). In a parallel work6, the quality decay of minced beef was also successfully evaluated by means of colour evaluation, thiobarbituric acid (TBA) determination, CO2 production inside the packaging and volatile aroma compounds determination by an electronic-nose. The mean value of the times calculated for each index was nine days at 4.3°C, three to four days at 8.1°C and two days at 15.5°C. This time was defined as ‘stability time’, that corresponds to the maximum stability time for freshness decay. The storage of meat after this time was not acceptable. In comparison with these data, IR technique appears to anticipate the stability time, estimating a time associated with the initial freshness decay of the product. This could be due to the ability of NIR and MIR spectroscopy in revealing the chemical modification of protein, lipid and water, before that colour change and aroma modification are evident and instrumentally quantifiable in the minced beef.
Conclusions
The results of this work show the feasibility of NIR and MIR techniques for estimating real exposure conditions and quality decay of fresh minced beef during marketing. The time obtained by these methods were slightly lower than those archived with both traditional methods (total bacterial counts, thiobarbituric acid assay and colour evaluation) and with an electronic nose, thus anticipating the quality decay of the minced meat. Overall, these results show that NIR and MIR spectroscopy could support the conventional techniques in studying the shelf life of minced meat, i.e. its quality during storage in relation to the evolution of chemical and physico-chemical parameters. Moreover, due to their non-invasive nature, these techniques could be applied in on-line monitoring system.
References
1. Williams, P., & Norris, K. (2001). Near infrared technology in the agricultural and food industries, 2nd ed. St. Paul, Minnesota, USA: American Association of CerealChemist 2. Workman, J. (2001). Review of interpretive spectroscopy for Raman and infrared. In J. Workman (Ed.), Handbook of organic compounds (pp. 209−242). U.S.A.: Kimberly- Clark Corporation, Wisconsin 3. Prieto, N., Roehe, R., Lavín, P., Batten, G., & Andrés, S. (2009). Application of near infrared reflectance spectroscopy to predict meat and meat products quality: A review. Meat Science, 83, 175−186 4. Isaksson, T., Segtnan, H.V. (2006). Meat and Fish Products. In Near-Infrared Spectroscopy in Food Science and Technology. Ozaki, Y., McClure, W.F., Christy, A.A. John Wiley and Sons, Inc., Publication, pp 247-277 5. Fagan, C. C., & O’Donnell, C. (2008). Application of midinfrared spectroscopy to food processing systems. In J. Irudayaraj & C. Reh (Eds.), Nondestructive testing of food quality, Vol. 1. (pp. 119−142)USA: Blackwell Publishing 6. Limbo, S., Torri, L., Sinelli, N., Franzetti, L., & Casiraghi, E. (2010). Evaluation and predictive modeling of shelf life of minced beef stored in high-oxygen modified atmosphere packaging at different temperatures. Meat Science, 84, 129−136
About the Author
Nicoletta Sinelli graduated in Food Science and Technology at the University of Milan, discussing an experimental thesis concerning the application of NIR spectroscopy to the milk coagulation. On March 2006, she received her PhD in Food Biotechnology, discussing a thesis about the application of NIR spectroscopy in food quality evaluation and process control. Currently she has a Post-doctoral position at DiSTAM of the University of Milan. She is working in the research group of food technology, where she applied near and mid infrared spectroscopy for the determination of food authenticity and for monitoring the molecular changes in technological process. She took part in several research projects as the national and international projects. She is author and co-author of scientific papers published on international and national journals and national and international proceeding of congresses on the research fields of infrared spectroscopic applied to food.


