NIR and class-modelling methods for brand protection in food and beverages
- Like
- Digg
- Del
- Tumblr
- VKontakte
- Buffer
- Love This
- Odnoklassniki
- Meneame
- Blogger
- Amazon
- Yahoo Mail
- Gmail
- AOL
- Newsvine
- HackerNews
- Evernote
- MySpace
- Mail.ru
- Viadeo
- Line
- Comments
- Yummly
- SMS
- Viber
- Telegram
- Subscribe
- Skype
- Facebook Messenger
- Kakao
- LiveJournal
- Yammer
- Edgar
- Fintel
- Mix
- Instapaper
- Copy Link
Posted: 6 September 2011 | Professor Gerard Downey, Teagasc Food Research Centre Ashtown | No comments yet
The penetration of on-line NIR equipment in the food processing industries continues to grow as companies realise the full potential of this technique. For the most part, it is deployed to monitor concentrations of key components in a raw material or finished food product and, with the use of feedback control systems, rectify deviations from specification before any problems arise. However, NIR spectroscopy has the potential to play a much greater role in food companies and one key area has to be its use as a fingerprint technique to monitor conformance to specification or to afford a significant level of brand protection through real-time comparison of such spectral fingerprints to established company norms for any given product. This article reviews some recent developments in this area and, in particular, explains some new chemometric approaches which may be exploited for this purpose.
Quality is an important determinant of food choice by consumers but it is a credence attribute i.e. a property that cannot be verified by the consumer at point of purchase. Quality perception is most likely to be derived from other intrinsic or extrinsic clues such as brand name for example. To ensure repeat purchasing based on a quality attribute, therefore, a major challenge facing food companies is the collection of real-time data on products leaving the production line to demonstrate consistency i.e. continued conformance to their own production specifications.
The penetration of on-line NIR equipment in the food processing industries continues to grow as companies realise the full potential of this technique. For the most part, it is deployed to monitor concentrations of key components in a raw material or finished food product and, with the use of feedback control systems, rectify deviations from specification before any problems arise. However, NIR spectroscopy has the potential to play a much greater role in food companies and one key area has to be its use as a fingerprint technique to monitor conformance to specification or to afford a significant level of brand protection through real-time comparison of such spectral fingerprints to established company norms for any given product. This article reviews some recent developments in this area and, in particular, explains some new chemometric approaches which may be exploited for this purpose. Quality is an important determinant of food choice by consumers but it is a credence attribute i.e. a property that cannot be verified by the consumer at point of purchase. Quality perception is most likely to be derived from other intrinsic or extrinsic clues such as brand name for example. To ensure repeat purchasing based on a quality attribute, therefore, a major challenge facing food companies is the collection of real-time data on products leaving the production line to demonstrate consistency i.e. continued conformance to their own production specifications.
The penetration of on-line NIR equipment in the food processing industries continues to grow as companies realise the full potential of this technique. For the most part, it is deployed to monitor concentrations of key components in a raw material or finished food product and, with the use of feedback control systems, rectify deviations from specification before any problems arise. However, NIR spectroscopy has the potential to play a much greater role in food companies and one key area has to be its use as a fingerprint technique to monitor conformance to specification or to afford a significant level of brand protection through real-time comparison of such spectral fingerprints to established company norms for any given product. This article reviews some recent developments in this area and, in particular, explains some new chemometric approaches which may be exploited for this purpose.
Quality is an important determinant of food choice by consumers but it is a credence attribute i.e. a property that cannot be verified by the consumer at point of purchase. Quality perception is most likely to be derived from other intrinsic or extrinsic clues such as brand name for example. To ensure repeat purchasing based on a quality attribute, therefore, a major challenge facing food companies is the collection of real-time data on products leaving the production line to demonstrate consistency i.e. continued conformance to their own production specifications. A brand name is a significant asset for any company and its protection must rank high on the list of critical tasks for staff at all levels in a processing company. A particular responsibility rests with those charged with production oversight and analytical support since it is in these sections that deviations from specification should be speedily detected and rectified. Often, these analytical activities have focused on standard compositional measurements but it may be the case that this approach is insufficient on its own to completely explain overall properties of a particular product.
NIR spectroscopy has been advocated as a powerful fingerprint technology i.e. a scan of any given sample is regarded as representing the combined signal from all of the opticallyactive components as affected by the overall sample matrix and other, often minor, components. Conceptually, then, it is easy to see that a powerful quality assurance procedure would involve the collection of fingerprint spectra from production samples at regular intervals and their comparison to a library of spectra previously collected from other samples known to be within acceptable quality limits. This reference collection should ideally include a range of quality levels within this acceptable quality envelope since production processes are never constant. The mechanism for this comparison is a critical component of any such system and some relatively new procedures have recently been advocated. These are explained below together with their deployment in a specific example involving the identity confirmation of a particular Belgian beer.
Classification and class-modelling techniques
The overall general aim of both these techniques is to provide a qualitative answer to the specific problem studied, namely the identification of samples as belonging to a particular class: both classification and classmodelling methods address this general aim but, in spite of their apparent similarity, they provide very different solutions. Classification methods have tended to be used more often, perhaps because they can be found in most of the commercially-available chemometric software packages. However, in many cases, the class-modelling approach is to be preferred while in particular examples the combination of both could be effective. Typically, the classification (discriminant) approach answers a question such as – to which of classes A, B and C does sample one belong? A classification method builds a boundary that divides the sample domain into a number of sub-areas corresponding to the known classes. As a consequence, a sample is always classified as probably belonging to one of the classes studied, even if it is located very far from all the classes – it may actually belong to another class not considered in the training sample set or may be an outlier of one of the classes considered. Nonetheless, discriminant approaches have been widely used and work well in many, especially well-defined, applications.
In contrast, class-modelling methods focus on characterising each of the classes involved and identifying samples being tested against the properties of each of the models. They do not calculate boundaries between two or more classes. Class-modelling methods build a closed boundary around the class space of each category studied and this boundary is then used to verify whether a sample falls inside or outside the class. In other words, class-modelling approaches answer the following question — can it be confirmed that sample X, which claims to belong to class A, does actually belong to class A? The outcome can be that a sample is assigned to one class, more than one class or to no class. It follows that class-modelling approaches are intuitively more appropriate than classification strategies in addressing most questions of brand confirmation.
How do they work?
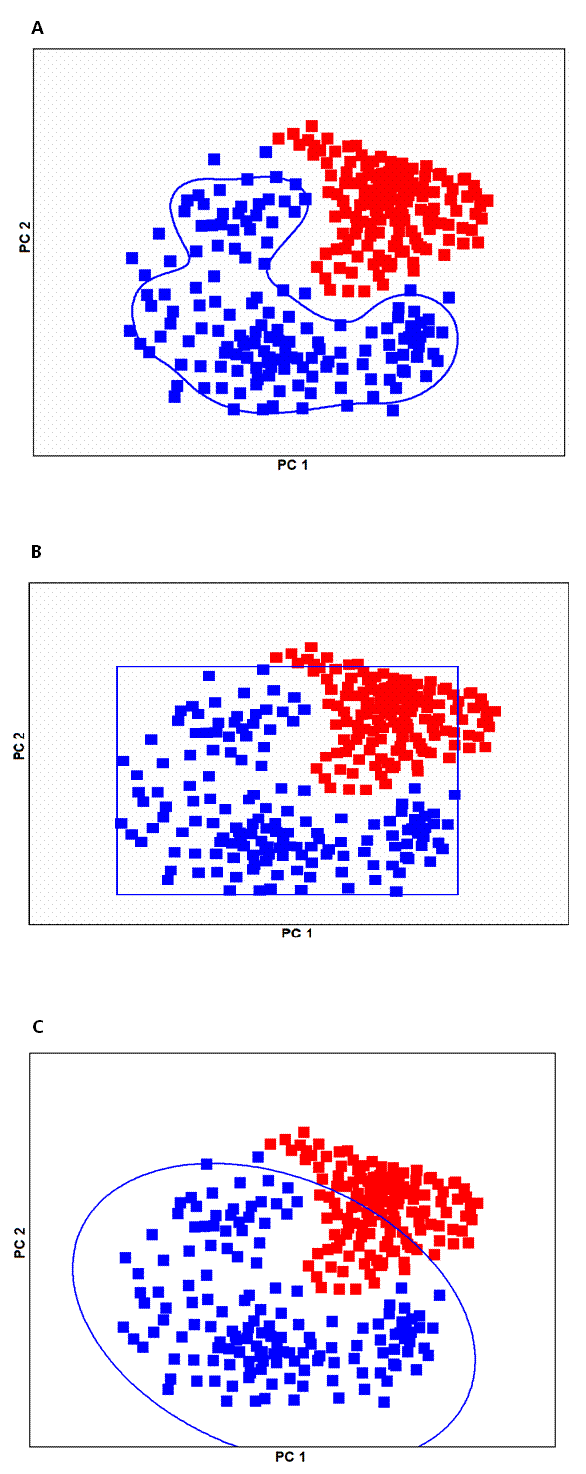
A common discriminant method is partial least squares (D-PLS) regression; it is applied using dummy Y-variable values of 0 and 1 for each of the relevant classes being discriminated. Results from discriminant PLS are predicted Y-values for each sample and class assignment is often based on the predicted value exceeding or falling below a value of 0.5; overall performance is normally expressed as a percentage correct classification value. Three class-modelling methods have been studied recently – these have the acronyms SIMCA, POTFUN and UNEQ. SIMCA (soft independent modelling of class analogy) models are defined by the range of sample scores on a selected number of principal components. SIMCA is a very flexible technique since it allows variation in a large number of parameters such as scaling or weighting of the original variables, number of components, expanded or contracted scores range etc. UNEQ (unequal class spaces) is derived from quadratic discriminant analysis (QDA) and each UNEQ model is the centroid of a given class. The shape and the orientation of the model depend on the correlation between the variables; if sample distribution in variable space is not uniform, UNEQ may not provide satisfactory results. Potential function techniques (POTFUN) however estimate a probability density distribution based on the contributions of each single object in the calibration set. POTFUN can cater for very complex distributions, capable of effectively describing non-uniform distributions of samples e.g. the presence of several subcategories of samples.
Class-model performance is judged on three parameters – sensitivity, specificity and efficiency. Sensitivity is defined as the percentage of objects in the prediction set known to belong to the modelled class which are accepted by the model; specificity is the percentage of objects in the prediction set which do not belong to the modelled category and which are rejected by the model. Efficiency is the geometric mean of sensitivity and specificity values.
A graphical representation of these three class-modelling techniques is shown in Figure 1.


Figure 1 Graphical illustration of class-modelling methods based on scores on two principal components; (a) SIMCA, (b)UNEQ and (c) POTFUN. Blue squares = samples belonging to the model; red squares = samples outside the model (Reprinted from Food Chem., 125 (2011) 1450–1456 with permission from Elsevier)
In this study, the main objective was to confirm the declared identity of a particular Trappist beer, namely Rochefort 8°; this is not a real commercial issue but was chosen because of the likely difficulty of the problem. Trappist beer is a successful commercial product with strict rules, laid down by the International Trappist Association, governing its production. It is viewed as a high quality beer. Only beers which are brewed under the control of Trappist monks may use the text ‘Authentic Trappist Product’ and the Trappist logo on their labels – there are seven such breweries in total, six in Belgium and one in The Netherlands. Rochefort is one of the Trappist breweries in Belgium and produces a number of different but related premium beers e.g. Rochefort 8° and Rochefort 10° beers with finished alcohol contents of 9.2 and 11.3 per cent alcohol by volume (ABV) respectively. The strategy adopted to confirm that a beer labelled Rochefort 8° was actually Rochefort 8° included a number of steps. Class-modelling methods (SIMCA, POTFUN and UNEQ) were used to build models for identification of a beer as Trappist or not, then separately as Rochefort or not while a classification technique (D-PLS) was finally applied to discriminate between Rochefort 8° and Rochefort 10° beers.
A total of 275 beer samples were collected from a number of retail outlets over a period of several months. These comprised 143 Trappist and 132 non-Trappist beers. In general, two bottles of each beer belonging to different production batches were obtained although that was not always possible. Fifty-one Rochefort 8° and 25 Rochefort 10° were included in the collection. Beers were sampled and scanned in random order and separate calibration and prediction sample samples were used for model development and evaluation. Samples of beer were transferred by pipette into a camlock cell (0.1 millimetre sample thickness) comprising a quartz lid, gold-plated backing disc and a screw-on back. Transflectance spectra were recorded between 1100 and 2360 nanometres at two nanometre increments on a scanning spectrophotometer (NIRSystems 6500, NIRSystems Inc., Maryland, USA).
Question 1: Trappist or not?
The first step was to confirm that a beer labelled as Trappist conformed to the Trappist model; results for the best class-models are shown in Table 1. SIMCA produced the best overall model efficiency values, mainly as a reflection of the higher specificity of the models developed; SIMCA models did not produce the highest sensitivity figures. This discrepancy between sensitivity and specificity values is a reflection of the inhomogeneity of the non-Trappist beer class which may be expected to include very significant variation.
Table 1. Summary of class-modelling results for beer spectra
|
Model |
Sensitivity % |
Specificity % |
Efficiency % |
|
|
Trappist |
SIMCA |
75.8 |
68.6 |
72.1 |
|
UNEQ |
93.6 |
25.7 |
49.0 |
|
|
POTFUN |
96.8 |
22.9 |
47.0 |
|
|
Rochefort |
SIMCA |
77.8 |
85.3 |
81.4 |
|
UNEQ |
94.4 |
68.9 |
80.6 |
|
|
POTFUN |
91.7 |
39.4 |
60.1 |
Question 2: Rochefort or not?
In a second step, beer spectra were tested to see if they conformed to the Rochefort model characteristics. In this case, (Table 1), it is clear that much higher specificities were obtained, a reflection of the greater homogeneity of the beers in this class. The best model overall was judged to be produced by UNEQ with a sensitivity of 94.4 per cent although the specificity was lower at 68.9 per cent.
Question 3: Rochefort 8° or Rochefort 10°?
In a final step, a classification model was developed to discriminate between these closely-related beers. Results show that the best model produced an average correct classification rate for the prediction sample set of 93.4 per cent, with 100 per cent for Rochefort 8° and 86.7 per cent for Rochefort 10° beers respectively.
Conclusions
In this article, both class-modelling and discriminant classification have been used to solve identification issues involving a particular beer brand using a sequential approach. For identity confirmation of Trappist beers, only mediocre levels of sensitivity and specificity were obtained, with SIMCA performing best. Reasons for this result may include a very complex distribution of the data being modelled. Additionally, inclusion of variables which contained little or no information relevant to the modelling problem may have hampered development of better models. Further study after elimination of non-informative variables is warranted. Models for confirming identity as Rochefort or non-Rochefort and Rochefort 8° or Rochefort 10° were more successful.
This combination of class-modelling and classification approaches to identity con – firmation holds great promise for brand protection and overall quality measurement not least because these class-modelling approaches are underpinned by rigorous statistical theory and are intuitively appropriate. They deserve greater attention from the quality assurance and regulatory bodies in the food industry.
Gerard Downey works in the Food Chemistry and Tech – nology Department at the Teagasc Food Research Centre, Ashtown, Dublin, Ireland and holds the post of Adjunct Professor in the School of Agriculture, Food and Veterinary Science at University College Dublin. His main research interests lie in the application of fingerprint spectroscopic techniques (mainly near infrared and mid-infrared) and multivariate data analysis to the rapid, direct and non-destructive measurement of food quality. He is a member of the Board of Directors of the American Association of Cereal Chemists International, Editor of NIR News and European Editor of the Journal of Near Infrared Spectroscopy. He has participated widely in EU and nationallyfunded research projects, published over 110 peer-reviewed papers and contributed 10 book chapters.


