On-line NIR for monitoring and control of fat in batches of meat trimmings
- Like
- Digg
- Del
- Tumblr
- VKontakte
- Buffer
- Love This
- Odnoklassniki
- Meneame
- Blogger
- Amazon
- Yahoo Mail
- Gmail
- AOL
- Newsvine
- HackerNews
- Evernote
- MySpace
- Mail.ru
- Viadeo
- Line
- Comments
- Yummly
- SMS
- Viber
- Telegram
- Subscribe
- Skype
- Facebook Messenger
- Kakao
- LiveJournal
- Yammer
- Edgar
- Fintel
- Mix
- Instapaper
- Copy Link
Posted: 5 March 2012 | Jens Petter Wold, Nofima AS | No comments yet
In the meat industry, the profit margins are small and profitability depends on optimal utilisation of the carcasses. From slaughter to final product, the industry controls much of the production according to certain quality criteria such as muscle quality, fat and connective tissue content. One of the main products from the pork and beef deboning plants is batches of meat trimmings, which are valued by fat content; the lower the fat content, the higher the purchase value. As much as 60 per cent of the beef carcasses and about 45 per cent of pork carcasses ends up as trimmings. Improved industrial control of fat content in these batches would substantially add to profitability for many companies.
Industrial practice today is that the workers in the processing line adjust their cutting, based on training and experience, to reach target fat per cent in the batches. They manually sort the trimmings to make batches of typically 14, 18 or 24 per cent fat. However, this is a difficult task and large deviations from target fat content are common. This has led to the development of automatic monitoring systems for fat in the meat. At least three different measurement principles are in use today. The systems are based on non-invasive techniques such as microwaves, X-rays or near-infrared spectro – scopy (NIR)1. These systems are used to check that the target fat content of the batches is correct. The microwave and NIR systems usually require that the meat is ground before measurement. Many customers prefer intact meat trimmings for further processing since this product is supposed to have better technological quality than ground beef.
In the meat industry, the profit margins are small and profitability depends on optimal utilisation of the carcasses. From slaughter to final product, the industry controls much of the production according to certain quality criteria such as muscle quality, fat and connective tissue content. One of the main products from the pork and beef deboning plants is batches of meat trimmings, which are valued by fat content; the lower the fat content, the higher the purchase value. As much as 60 per cent of the beef carcasses and about 45 per cent of pork carcasses ends up as trimmings. Improved industrial control of fat content in these batches would substantially add to profitability for many companies. Industrial practice today is that the workers in the processing line adjust their cutting, based on training and experience, to reach target fat per cent in the batches. They manually sort the trimmings to make batches of typically 14, 18 or 24 per cent fat. However, this is a difficult task and large deviations from target fat content are common. This has led to the development of automatic monitoring systems for fat in the meat. At least three different measurement principles are in use today. The systems are based on non-invasive techniques such as microwaves, X-rays or near-infrared spectro - scopy (NIR)1. These systems are used to check that the target fat content of the batches is correct. The microwave and NIR systems usually require that the meat is ground before measurement. Many customers prefer intact meat trimmings for further processing since this product is supposed to have better technological quality than ground beef.
In the meat industry, the profit margins are small and profitability depends on optimal utilisation of the carcasses. From slaughter to final product, the industry controls much of the production according to certain quality criteria such as muscle quality, fat and connective tissue content. One of the main products from the pork and beef deboning plants is batches of meat trimmings, which are valued by fat content; the lower the fat content, the higher the purchase value. As much as 60 per cent of the beef carcasses and about 45 per cent of pork carcasses ends up as trimmings. Improved industrial control of fat content in these batches would substantially add to profitability for many companies.
Industrial practice today is that the workers in the processing line adjust their cutting, based on training and experience, to reach target fat per cent in the batches. They manually sort the trimmings to make batches of typically 14, 18 or 24 per cent fat. However, this is a difficult task and large deviations from target fat content are common. This has led to the development of automatic monitoring systems for fat in the meat. At least three different measurement principles are in use today. The systems are based on non-invasive techniques such as microwaves, X-rays or near-infrared spectro – scopy (NIR)1. These systems are used to check that the target fat content of the batches is correct. The microwave and NIR systems usually require that the meat is ground before measurement. Many customers prefer intact meat trimmings for further processing since this product is supposed to have better technological quality than ground beef.
There are systems based on X-rays that can be used on intact meat, either on already filled boxes or on streams of trimmings (SensorX by Marel Ltd, Iceland and MeatMaster by FOSS, Denmark). The advantage of X-rays compared to NIR is that the measurements are done in transmission so that the entire volume of the meat is sampled. This also enables fat estimates for heterogeneous materials. Advantages with NIR compared with X-rays are that the systems are easier to incorporate in production lines since radiation protection is not required and it is more compact. Another major advantage over X-ray is that NIR systems would normally be delivered to a much lower cost and be affordable also for medium and smaller sized companies.
During the last few years, new imaging NIR technology has been developed that allows in-line measurements of fat on single intact food products. This technology is based on an on-line NIR imaging scanner, originally developed and designed for moisture deter – mination in dried salted cod2 and fat and colour in salmon fillets3. The system optically probes about the upper two centimetres of the samples, which means that more representative spectral measurements can be obtained from heterogeneous samples compared to reflectance measurements, which mainly represent the surface. One illustrative example is an application where the edible food content in live crabs is measured and determined through the dark brown shell (carapace)4. This NIR scanner is now commercially available under the name QVision 500 and is sold by Odenberg Ltd, among other things for fat determination in ground meat.
Based on the above results it was obvious to also evaluate this imaging NIR scanner for fat determination in meat trimmings. Intact trimmings are much more challenging than ground meat since they are very heterogeneous in size, shape and how the fat is distributed. The NIR system measures about two centimetres into the meat, that is, only the upper layer will be probed. Even if the fat content in this upper layer is correctly quantified, it does not have to be representative or correct for the whole trimming on average.
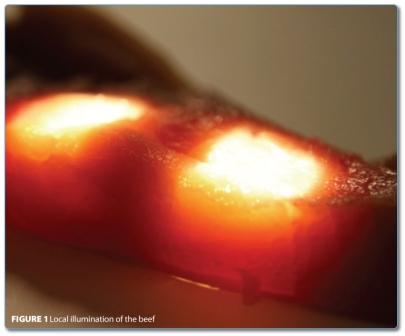

Figure 1 shows how the meat is illuminated. Two bright spots of light are focused on the meat, and the signal is measured between those two spots ensuring that the light has travelled inside the meat. This optical measurement is then scanned across the entire conveyor belt making up spectral images in the NIR region.
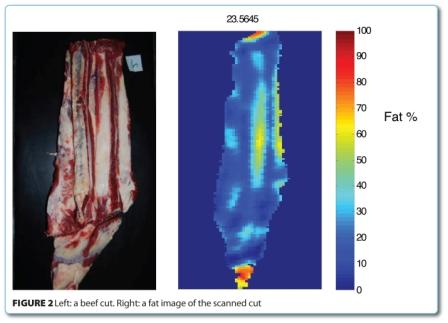

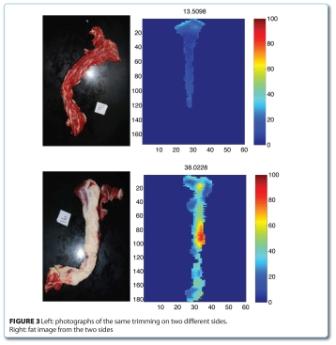
Figure 2 shows an example of the output of the system. It is calibrated to produce a fat estimate in each pixel of the trimming, as well as giving an estimate of the average fat content. From the fat image, it can be seen that parts of the white tissue are not only fat, but to a large extent connective tissue with a relatively low fat content. The actual fat content (measured by a lab reference method) of this trimming of 1.6 kilograms was 24.9 per cent, while the NIR estimate was 22.5 per cent. This is a notable deviation and illustrates the challenge of using this technology on intact meat. Figure 3 (page 49) illustrates this even more clearly, where the same trimming is measured on both sides. On one side it is estimated at 13.5 per cent fat, while on the other side, 38 per cent. The actual average fat value is 26.9 per cent, not very far from the average of the estimates from the two sides (25.7 per cent).

With these inaccuracies it is not obvious how this methodology can be used for fat monitoring in meat trimmings. However, in most cases it is not of interest to know the exact composition of every single trimming, but of the larger batches of trimmings. Trimmings are usually produced in batches varying in size from around 20 to 800 kilograms. The aim is then to measure the average fat content in a stream of trimmings from the cutting line, randomly placed on the conveyor belt. This is a different situation, since it is possible to average the results from large quantities of meat. Trimmings like those shown in Figures 1 and 2 will be measured, sometimes exposing the lean side to the scanner, other times the fat side. When the batches grow larger, the heterogeneity of the trimmings will be averaged out, and the fat estimates will be quite accurate. Figure 4 (page 50) shows the prediction error (root mean square error of prediction) for fat in batches as function of batch size.
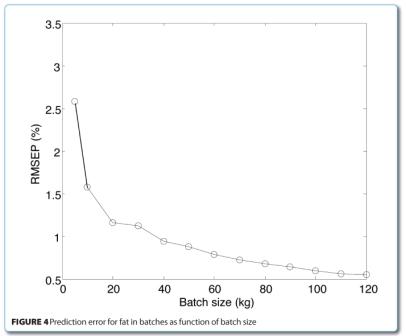

This curve is simulated based on 120 scanned trimmings where also the actual fat content was measured by a lab reference method. It can be seen that the prediction error decreases rapidly when the batch gets bigger and levels out at about 0.6 per cent for 100 kilograms. A prediction error of ±0.6 per cent is low and comparable with what is reported with NIR on ground beef. The trace of this curve can vary with the properties of the trimmings. If they are very heterogeneous and fat, then more meat might be required before the prediction error levels off at a low value. A requirement is, as mentioned above, that the trimmings are randomly oriented. If they systematically expose for example the most fat side to the instrument, then the batch fat estimate will be too high. The results from the simulations have been verified by real measurements on beef5. On 13 small batches varying in size from 11 – 25 kilograms, a prediction error of 1.34 per cent was obtained. For larger batches of about 200 kilograms the NIR system obtained about the same results as an in-line microwave system used on the ground meat.
This concept of measuring the average fat content in batches of beef trimmings has been evaluated in a Norwegian beef cutting facility. The scanner was placed at the end of the cutting line where the trimmings were collected in batches. The cutters are trained to produce batches of typically 14 or 21 per cent fat, however, this is a difficult task. With the NIR system it is possible to continuously measure and estimate the average fat content in the batch under production. This varying value can be shown on a screen, and the cutters can use this to control the end fat content of the batch. If the value is too low, more fatty trimmings can be added and vice versa. Figure 5 shows a picture of this rather simple way to control the process.
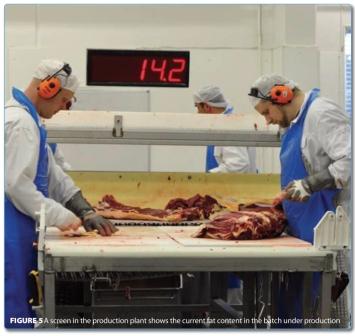

An ongoing Norwegian R&D project is now elucidating if it is possible to automate this process control. The scanner will estimate the fat content of every single trimming, and these will be sorted into batches of different target fat content by an automatic grader system. The grader will be controlled by sorting algorithms which optimises simultaneously the fat content in e.g. three or four different batches under production. In this way the cutters can concentrate on maximising cutting yield and not on obtaining the correct batch fat content.
In this article it is focused on how NIR imaging spectroscopy can be used on very heterogeneous meat trimmings and the challenges and opportunities with this approach. It should also be mentioned that that the technology can be used for reliable fat estimation in single meat cuts in certain cases of interest. High quality cuts such as pork loins are often valued by fat content. These cuts are overall of the same shape and physiology, and then it is possible to make designed fat calibrations for exactly these cuts. It is then possible to classify them into at least three to four fat classes that can be used for in-line grading.
Most of the R&D work described in this article is carried out by the company Odenberg who develops and produces the NIR scanner and the Norwegian R&D institutes Sintef ICT (expertise in optical instrumentation) and Nofima AS (expertise in applied spectroscopy for foods). Other important partners have been Animalia – Meat and Poultry Research Centre in Norway, as well as several European meat processing companies. The complexity of the technology and the developed applications is high, and multidisciplinary work with contributions from both research and industry is key for success.
References
1. Hildrum, K.I., Wold, J. P., Segtnan, V. H., Renou, J. P., Dufour, E. (2006). New spectroscopic techniques for on-line monitoring of meat quality. In: L. M Nolet & F. Tóldra (Eds.), Book On Advanced Technologies for Meat Processing. CRC Press, Taylor and Francis Group, 2006
2. Wold, J. P., Johansen, I. R., Haugholt, K. H., Tschudi, J., Thielemann, J., Segtnan, V. H., Narum, B. & Wold, E. (2006). Non-contact transflectance near infrared imaging for representative on-line sampling of dried salted coalfish (bacalao). Journal of Near Infrared Spectroscopy,14, 59–66
3. Segtnan, V. H., Høy, M., Lundby, F., Narum, B. & Wold, J. P. (2009). Fat distributional analysis in salmon fillets using non-contact near infrared interactance imaging: A sampling and calibration strategy. Journal of Near Infrared Spectroscopy, 17, 247-253
4. Wold, J. P., Kermit, M., & Woll, A. (2010). Rapid nondestructive determination of edible meat content in crabs (Cancer Pagurus) by NIR imaging spectroscopy. Applied Spectroscopy, 64, 691-699
5. Wold JP, O’Farrel M, Høy M, Tschudi J. On-line determination and control of fat content in batches of beef trimmings by NIR imaging spectroscopy. Meat Science 89: 317-324 (2011)


