NIR approaches to food provenance determination and confirmation
- Like
- Digg
- Del
- Tumblr
- VKontakte
- Buffer
- Love This
- Odnoklassniki
- Meneame
- Blogger
- Amazon
- Yahoo Mail
- Gmail
- AOL
- Newsvine
- HackerNews
- Evernote
- MySpace
- Mail.ru
- Viadeo
- Line
- Comments
- Yummly
- SMS
- Viber
- Telegram
- Subscribe
- Skype
- Facebook Messenger
- Kakao
- LiveJournal
- Yammer
- Edgar
- Fintel
- Mix
- Instapaper
- Copy Link
Posted: 20 February 2009 | Gerard Downey, Principal Research Officer, Teagasc, Ashtown Food Research Centre | No comments yet
Globalisation has been a significant factor behind the financial meltdown in which we all find ourselves now, but it has also led to significant changes in the variety and origin of the foodstuffs which line our supermarket shelves. In previous articles, I have discussed some analytical responses to the concerns which consumers have regarding claims made on the labels of processed foods; fingerprint technologies, such as near infrared spectroscopy, possess specific features which make them well-suited for deployment to address at least some of these concerns. The focus of this article is on the appropriate chemometric strategy to deploy in the confirmation or determination of issues of the provenance of a food or food ingredient.
Globalisation has been a significant factor behind the financial meltdown in which we all find ourselves now, but it has also led to significant changes in the variety and origin of the foodstuffs which line our supermarket shelves. In previous articles, I have discussed some analytical responses to the concerns which consumers have regarding claims made on the labels of processed foods; fingerprint technologies, such as near infrared spectroscopy, possess specific features which make them well-suited for deployment to address at least some of these concerns. The focus of this article is on the appropriate chemometric strategy to deploy in the confirmation or determination of issues of the provenance of a food or food ingredient.
Globalisation has been a significant factor behind the financial meltdown in which we all find ourselves now, but it has also led to significant changes in the variety and origin of the foodstuffs which line our supermarket shelves. In previous articles, I have discussed some analytical responses to the concerns which consumers have regarding claims made on the labels of processed foods; fingerprint technologies, such as near infrared spectroscopy, possess specific features which make them well-suited for deployment to address at least some of these concerns. The focus of this article is on the appropriate chemometric strategy to deploy in the confirmation or determination of issues of the provenance of a food or food ingredient.
Provenance may be linked to the geographic origin of the food or to the method of its production. In European countries, there is a strong belief in the link between the quality of a given food and its geographic provenance; an example of this is in the French concept of terroir. In any case, in an effort to increase market growth and profitability, many food producers are making claims for the provenance of their products which allow them to charge a premium price. The basis for some of these claims is recognised in EU legislation, which defines specific terms that may be used by producers of certain foods in particular, defined geographic regions within Europe. These are Protected Denomination of Origin (PDO), Protected Geographical Indication (PGI) and Traditional Speciality Guaranteed (TSG).
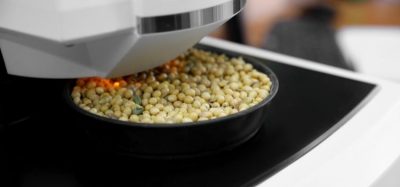
Near infrared spectroscopy has been applied to aspects of this provenance problem on the basis that a NIR spectrum can act as a fingerprint of the molecular composition and organisation of a food or food ingredient. This fact has enabled its successful and widespread deployment for the quantitative analysis of food composition and investigations into its potential for addressing qualitative problems. Such studies have been a major focus of the NIR research programme at the Ashtown Food Research Centre of Teagasc for a number of years; currently our participation in the EU-funded project ‘TRACE: tracing the origin of foods in Europe’ provides a focus on provenance issues involving olive oil, honey, beef and beer. This project (www.trace.eu.org) has provided unique opportunities for the sourcing of authentic foods and for collaboration in the application of chemometric approaches to issues of provenance among research partners across Europe and further afield.
What is the question?
Success or failure in any research activity firstly requires that the problem to be investigated is defined. Regarding geographic provenance, two possible questions may be envisaged;
(a) Is this product from the region in which it claims to originate according to the label?
(b) In which of a defined number of possible regions or countries does this product originate?
The importance of defining the question arises from the fact that the chemometric methods to be applied in addressing the scenarios in (a) and (b) are quite different. Regarding the former, the emphasis is on developing a mathematical model that characterises a food from the region of interest; the effectiveness of such models are measured using the parameters sensitivity and specificity. Sensitivity is the percentage of samples known to originate in a region which is correctly identified as such by a model for that region. Specificity is the percentage of samples which are known not to originate in a region which is correctly classified by the same model.
In the second case, the mathematical approach is to develop a model which can differentiate between samples from the defined and limited number of geographical sources. This involves the use of discriminant methods. A conventional approach to the characterisation of such models is calculation of the percentage correct classification of samples known to belong to each of the regions involved and should include the percentage of false positive and false negative identifications.
Some examples
Let us consider the following problems which are selected purely to demonstrate suitable analytical approaches rather than real commercial scenarios.
Problem 1
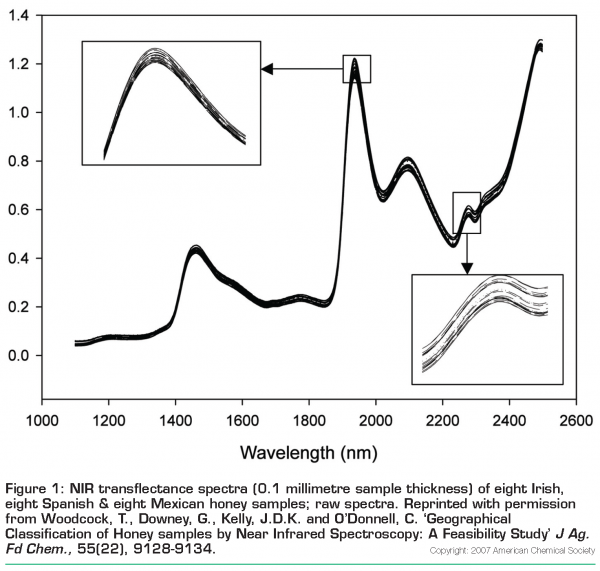
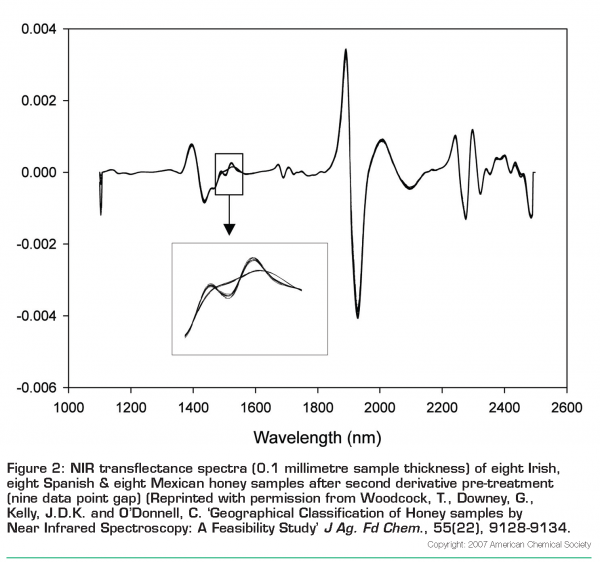
Honey is available from Ireland, Mexico and Spain – can NIR spectroscopy discriminate accurately between them and correctly identify the geographic origin of unknowns from these countries? This problem was investigated1 using unfiltered samples from Ireland (n=88), Spain (n=25) and Mexico (n=54). Spectra were collected in transflectance mode using a sample thickness of 0.1 millimetres in a camlock cell with a gold-plated disc reflector insert and a plot of a representative set of these honeys is shown in Figure 1 as raw spectra and in Figure 2 (page 20) after a second derivative data pre-treatment. In Figure 1, some differences between spectra of samples from the three countries can be seen, i.e. at 1936 nanometres, Spanish honeys have the lowest absorbance while the Irish and Mexican samples are overlapped. With regard to the peak at 2278 nanometres, the Irish samples have the highest absorbance with the Mexican and Spanish samples overlapped underneath them. The major features of these spectra are peaks at 1463 nanometres (OH, CH, and CH2 deformations), 1936 nanometres (OH combinations), and 2096 and 2278 nanometres (CH combinations). Transflectance spectra of aqueous solutions of fructose and glucose contain absorbance peaks at almost identical locations. The second-derivative plot (Figure 2) of these Irish, Mexican and Spanish honey samples reveals greater spectral detail, with minima corresponding to maxima in the original spectra. It is worth noting in this figure that there is a small section of the spectra between 1480 and 1560 nanometres where the Irish honey spectra can be seen to differ from Mexican and Spanish counterparts.

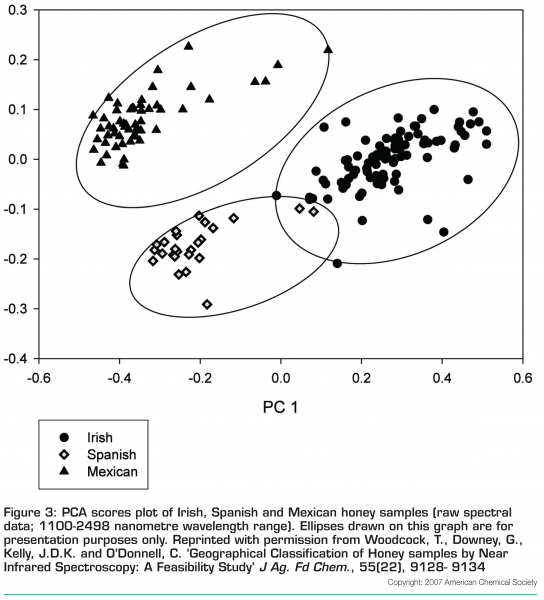
Principal component analysis was carried out on the raw data and the sample score plot for components 1 and 2 is shown in Figure 3 on page 21. Two main observations can be made from an examination of this plot; firstly, there are no obvious outlying samples in the group and secondly, with the exception of two Spanish samples, honeys from each of the three countries have clustered closely together in ellipsoid patterns and at some distance from the others. Principal component 1 chiefly effects a separation of Irish samples from those originating in the other two countries (Mexico and Spain).
Discriminant models were developed for these honeys using discriminant partial least squares regression (D-PLS2). In this procedure, dummy Y variables are developed with honeys from a particular group being ascribed the value 1 for that group and 0 for the others. Thus, given the three groups Ireland, Spain and Mexico, a sample from Mexico would have values of 0, 0, and 1 for these three Y variables while one from Ireland would be given values of 1, 0 and 0. Models were developed using two thirds of the samples for model development and the remaining third as a separate validation set. Using this procedure on raw spectral data and with only four PLS loadings, honey from each of the countries was 100 per cent correctly classified with no false positives in any case. Therefore, this approach to the analysis of NIR spectral data allows for a complete and accurate separation of honeys from the three countries involved. The limitations of a data set of this restricted size have to be borne in mind but the result is nonetheless promising. Problems may arise if a honey sample from a country which has not been included in this work is offered for analysis. For this reason, some type of distance measure would need to be included in the procedure so that a sample which did not closely resemble the sample types which have been examined would be flagged as suspicious in some way.

Problem 2
Extra virgin olive oil is produced in many countries around the Mediterranean Sea in particular. Taking olive oil produced in the Liguria region of Italy as an example, can NIR spectroscopy confirm that an oil sample which claims this geographic origin has the characteristics of authentic product which actually originates in Liguria? The preferred approach to this type of problem in which there is essentially only one class of material under study is to apply class-modelling chemometric methods. A variety of mathematical approaches are available under this general heading but the one selected as an example here is SIMCA (soft independent modelling of class analogy).
For this demonstration, olive oil samples were collected from a number of different areas in Europe over a period spanning three harvests: 2005 (63 samples from Liguria and 163 from other regions), 2006 (79 samples from Liguria and 173 from other regions) and 2007 (68 samples from Liguria and 116 from other regions). This extended sample collection period helped to maximise variability arising from the effects of weather, disease, location etc. All olive oils were stored in a refrigerated room (4°C) in the dark between delivery and spectral acquisition (less than two weeks), minimising the chance of any significant chemical change occurring during this time-period. Olive oil samples (50 millilitres approximately) were placed in screw-capped vials in a water-bath maintained at 30°C and allowed to equilibrate for 30 minutes prior to spectral acquisition. Transflectance spectra (1100-2498 nanometres) at two nanometre intervals (700 variables) of each sample were collected.

Class models are typically characterised by three parameters: sensitivity, specificity and efficiency. Sensitivity is the percentage of objects in a validation set belonging to the modelled class which are accepted by the model; specificity is the percentage of objects belonging to the other (un-modelled) category or categories in the validation set which are rejected by the model. Efficiency is the mean of these two parameters. In a perfect world, an efficiency of 100 per cent is the desired outcome of the modelling process but in practice values lower than that may still be commercially useful. What may be of equal or greater importance is the relative values of the sensitivity and specificity; acceptance or rejection of a model based on these percentages will depend on the specific application which is being addressed.
The highest model efficiency obtained (84.5 per cent) in this olive oil application involved nine principal components and a second derivative (21 data points) pre-treatment (unpublished data). This model was associated with sensitivity and specificity values of 81.4 and 87.7 per cent respectively, values which are very similar in magnitude. In calculating SIMCA models in this application, it was noteworthy that all required relatively large numbers of principal components, up to eight or nine in most cases. This number appears high but there was no obvious evidence of any over-fitting in these cases. Given that the nature of the problem involves modelling of what are likely to be very small differences in the chemical composition of the olive oils, the spectral impact of such differences may well reside in higher order principal components which therefore are required for effective models.
The sensitivity of this model is, of course, far short of the perfect and legally-desirable value of 100 per cent but it may well be high enough for a preliminary screening of the large numbers of olive oils that may be expected to require testing. It is also a positive feature of the model that the specificity is even higher at approximately 88 per cent. In any event, it is possible that before commercial deployment of this method, significantly greater numbers of samples would be collected and analysed leading to the development of models with even higher accuracy.
Conclusions
A number of important chemometric approaches for the analysis of NIR spectral data of two food products have been described. The specific approach to be used depends on the particular analytical problem to be addressed although as a rule, the class-modelling methods are likely to have greater relevance for the type of problem normally faced in food provenance issues. No reports of the utilisation of such models by commercial enterprises exist to my knowledge but the advantages they offer recommend more active engagement by the relevant food industries and other bodies.
Reference
- Woodcock, T., Downey, G., Kelly, J.D.K. and O’Donnell, C. “Geographical Classification of Honey samples by Near Infrared Spectroscopy: A Feasibility Study” J Ag. Fd Chem., 55(22), 9128-9134


