Can cheese maturity be measured using images?
- Like
- Digg
- Del
- Tumblr
- VKontakte
- Buffer
- Love This
- Odnoklassniki
- Meneame
- Blogger
- Amazon
- Yahoo Mail
- Gmail
- AOL
- Newsvine
- HackerNews
- Evernote
- MySpace
- Mail.ru
- Viadeo
- Line
- Comments
- Yummly
- SMS
- Viber
- Telegram
- Subscribe
- Skype
- Facebook Messenger
- Kakao
- LiveJournal
- Yammer
- Edgar
- Fintel
- Mix
- Instapaper
- Copy Link
Posted: 16 August 2019 | Hasitha Priyashantha | No comments yet
Predicting the maturity of cheese using NIR hyperspectral imaging technique – Doctoral student Hasitha Priyashantha at the Department of Molecular Sciences, et al, discusses their latest research.
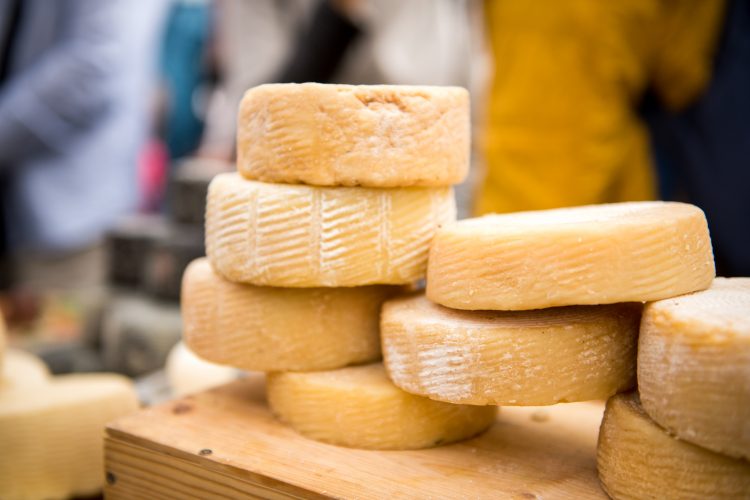

Predicting and monitoring the cheese ripening process is crucial for the dairy industry. In this context, the use of non-invasive techniques integrated online in the industrial process are of great interest. We used Near Infrared (NIR) hyperspectral (HS) imaging to predict cheese maturity in an applied project in collaboration with an industrial partner. Using partial least squares regression, we linked the NIR spectra of the cheeses to the concept of their maturity defined by age and evaluation of a sensory panel. Thereby, we demonstrated the possibility of using HS mages to detect differences in cheese maturity and illustrate the variation in maturity within and between cheeses.


Figure 1: Schematic illustration of hyperspectral imaging and model development
Cheese maturation
In the production of long-ripened cheese, it is crucial for the industry to monitor the ripening process. Cheese storage is costly and the maturation of cheeses is often not a fully predictable process (Fox et al., 1996). During maturation, the fresh cheese curd develops into a characteristic cheese with its particular flavour and texture. The formation of flavours are associated with the degradation of fat and protein (Collins, McSweeney, & Wilkinson, 2003), whereas the textural changes are mainly due to protein degradation (Verdini & Rubiolo, 2002). The distinctive properties of the matured cheese are a result of many factors, including native cheese milk enzymes, coagulants and activity of the starter bacteria culture (Fox et al., 1996). Moreover, the chemical composition and the microflora of the raw milk as well as storage conditions (temperature and humidity), will influence the maturation process (Robinson & Wilbey, 1998). Thus, cheese maturation is complex and multidimensional, and it is vital to monitor the development continuously in order to deliver the cheeses in due time to the markets.
Monitoring maturation
Currently, maturation and quality of long-ripened cheeses are mainly evaluated using conventional methods based on sensory and chemical characterisation (Coker, Crawford, Johnston, Singh, & Creamer, 2005). In the industry, a set of predetermined standards for the particular cheese is often used to identify the degree of maturity by the panel. A sensory panel, as a basis for classification, evaluates the characteristic flavour and texture of the matured cheese against the standards set by the industry.
These approaches are time-consuming, sample destructive and therefore, expensive. Moreover, cheese milk composition might be affected by farm management factors, including cow diets variations and season, which sometimes affects cheese maturation. Yet, it remains crucial to identify the appropriate maturity and deliver consistently matured cheese.
As a result, developing new knowledge regarding rapid and accurate tools to monitor cheese ripening is a necessity. The Swedish dairy cooperative, Norrmejerier, and researchers at SLU (Departments of Molecular Sciences, Uppsala, and Agricultural Research in Northern Sweden, Umeå) work together on applications to monitor cheese maturation using NIR HS imaging.
Doctoral student Hasitha Priyashantha from the Department of Molecular Sciences at the Swedish University of Agricultural Sciences (SLU), is performing this work as a part of his doctoral studies. “It is an innovative approach to track cheese maturation using spectral imaging technology,” he said. “The technique has already proved its capability to predict and distinguish variation in maturity of the cheese. Now, it is time to explore what more the technique can do and how methods can be further developed to improve the precision in predicting cheese maturity.”
The technology
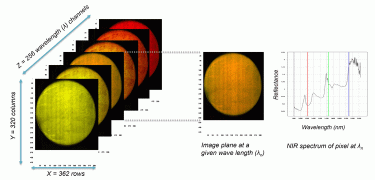

Figure 2: The data structure of a hypercube of hyperspectral imaging
A HS camera was used to scan intact cheeses (covered with paraffin wax) in parallel to sensory evaluation by a dairy sensory panel. HS images consist of three-way data matrixes, known as hypercubes. In a hypercube, a specific point is made with a pixel corresponding to a specific spectrum (Gowen et al., 2007). We used the spectral range of 937-2542 nanometres (nm) at increments of 6 nm to acquire the image, which resulted in a NIR-HS image (variable length x 320 pixels width) in 256 wavelength channels (Figure 2). Obtaining a complete NIR spectrum of each pixel is a powerful technique to characterise complex biological matrixes (Geladi, Burger, & Lestander, 2004). Our attempt was therefore to develop a predictive model by correlating the average NIR spectral profile of images of whole cheeses with the maturation time span and the sensory panel’s decisions.
During the model development steps, we pre-processed the HS images to reduce their bulkiness. Average spectra of pixels related to cheese were calculated and modelled using Breeze and Evince software of the company Prediktera AB (Umeå, Sweden). Pre-processing of images is an essential step in model development to improve spectral information and prepare data for further processing (Gowen et al., 2007). Large amounts of information are stored in a HS image, meaning sequential processing of image files using specific software is needed.
In our work we could demonstrate variation in spectral profiles in cheeses at various maturity levels. Yet, illustrating and understanding the variation in maturity of individual cheeses is tedious and nearly impossible due to the large data sets. Consequently, we applied partial least squares regression (multivariate calibration technique) in developing a model based on average cheese spectra. This enabled us to develop a calibrating model. Subsequently, the resulting model was cross-validated with another set of cheese images before further use.
Key wavelengths
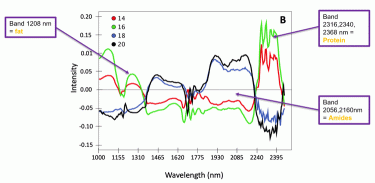

Figure 3: Spectral profile of four cheeses at different ages (14, 16, 18 and 20 months)
Identifying key wavelengths and alterations in spectra throughout the maturation process is essential in order to get a deeper understanding of the compositional changes that take place during ripening. Due to the large amount of information in the high-resolution images with broad spectra, graphical illustrations can be simplified by showing representative average spectra. In Figure 3 this has been done with single cheeses at four different scanning occasions with an increasing age (from 14 to 20 months). We could observe clear differences in spectral profiles of cheeses with 14-16 months ripening, compared to 18-20 months. The cheeses scanned later on in the ripening process showed indications of lower fat and protein content, due to enzymatic and microbial degradation, respectively, than the same cheeses scanned at an earlier stage. Our observations also suggested that, because of protein degradation, amides and peptides content was probably higher in the more mature cheeses.
Visualising the changes
In Figure 4 a common digital image of a cheese is shown for readers’ reference (A). Based on absorbance differences, we could clearly distinguish the region of interest from the background (B), where cheese absorbed more light than the background. In order to use only the region of interest in model development and further visualisations, we removed the background by removing the absorbance over 1.5 intensity level at 1279 nm wavelength. Thereby, we identified the pixels that represented the sample as shown in yellow outer line in lower left panel (C). The multivariate regression model was applied back pixel-wise to a set of test cheeses to visualise the maturity distribution of individual cheeses (D). Maturity distribution maps showed that the cheeses matured inhomogenously; the central part of the cheese was more mature than the outer periphery. We also observed that cheeses scanned after shorter ripening time showed a higher variation in maturity than older cheeses. Moreover, this visualisation provided useful information regarding differences between scanning occasions and various production batches.
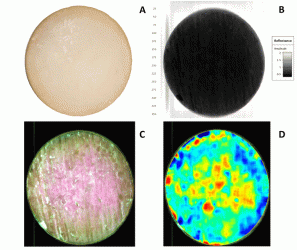

Figure 4: Different steps in visualisation maturity of a cheese with NIR-HS
Predictability and usability of the model
The model developed in the present study showed 76 percent accuracy in predicting the maturity of unknown cheeses. We concluded that NIR HS imaging coupled with multivariate regression methods have the potential of becoming an important tool to monitor cheese maturity and deliver cheeses to the market as they become mature.
The research group has presented some of the preliminary results from their on-going research at the International Dairy Federation (IDF) World Dairy Summit, 2017 in Belfast, UK, and recently published a full-length research article in Journal of Food Engineering (2019). This study was conducted with financial support from The Swedish Farmers’ Foundation for Agricultural Research and the Kamprad Family Foundation.
To read the full publication, click here.
About the authors
Hasitha Priyashantha is a PhD student at the Department of Molecular Sciences, Swedish University of Agricultural Sciences (SLU), Uppsala, Sweden. His research focuses on how cheese quality is affected by raw milk composition and properties.
Åse Lundh is Professor in Animal food science, Department of Molecular Sciences, SLU, Uppsala. Her research focus is raw milk quality and the dairy value chain.
Dr Mårten Hetta is Associate Professor in animal nutrition with focus on dairy production and ead of the Department of Agricultural Research for Northern Sweden at SLU, Umeå.
Dr Annika Höjer is Raw milk Specialist at the R&D department, Norrmejerier dairy company, Sweden.
References
Fox, P. F., Wallace, J. M., Morgan, S., Lynch, C. M., Niland, E. J., & Tobin, J. (1996). Acceleration of cheese ripening. Antonie van Leeuwenhoek, 70(2–4), 271–297. https://doi.org/10.1007/BF00395937
Collins, Y. F., McSweeney, P. L. H., & Wilkinson, M. G. (2003). Lipolysis and free fatty acid catabolism in cheese: a review of current knowledge. International Dairy Journal, 13(11), 841–866. https://doi.org/10.1016/S0958-6946(03)00109-2
Verdini, R. A., & Rubiolo, A. C. (2002). Texture Changes During the Ripening of Port Salut Argentino Cheese in 2 Sampling Zones. Journal of Food Science, 67(5), 1808–1813. https://doi.org/10.1111/j.1365-2621.2002.tb08727.x
Robinson, R. K., & Wilbey, R. A. (1998). Cheese maturation. In Cheesemaking Practice (pp. 271–287). https://doi.org/10.1007/978-1-4615-5819-4_15
Coker, C. J., Crawford, R. A., Johnston, K. A., Singh, H., & Creamer, L. K. (2005). Towards the classification of cheese variety and maturity on the basis of statistical analysis of proteolysis data—a review. International Dairy Journal, 15(6), 631–643. https://doi.org/10.1016/j.idairyj.2004.10.011
Gowen, A. A., O’Donnell, C. P., Cullen, P. J., Downey, G., & Frias, J. M. (2007). Hyperspectral imaging – an emerging process analytical tool for food quality and safety control. Trends in Food Science & Technology, 18(12), 590–598. https://doi.org/10.1016/j.tifs.2007.06.001
Geladi, P., Burger, J., & Lestander, T. (2004). Hyperspectral imaging: calibration problems and solutions. Chemometrics and Intelligent Laboratory Systems, 72(2), 209–217. https://doi.org/10.1016/j.chemolab.2004.01.023
Related topics
Equipment, Quality analysis & quality control (QA/QC), Research & development, Technology & Innovation


